

ETHUSD Medium-term Trend: Bullish
Resistance: $825, $815, $800
Support: $740, $750, $760
Yesterday, May 3, Ethereum broke its psychological level at $700. Ethereum reached the high of $788 and price pulled back to the low of $760 and has since rallied. The MACD line and the signal line were above the zero line. Today, price of the asset is trading at $799.70 as at the time of writing. From the weekly chart, price of the asset is rising as per the indicator.
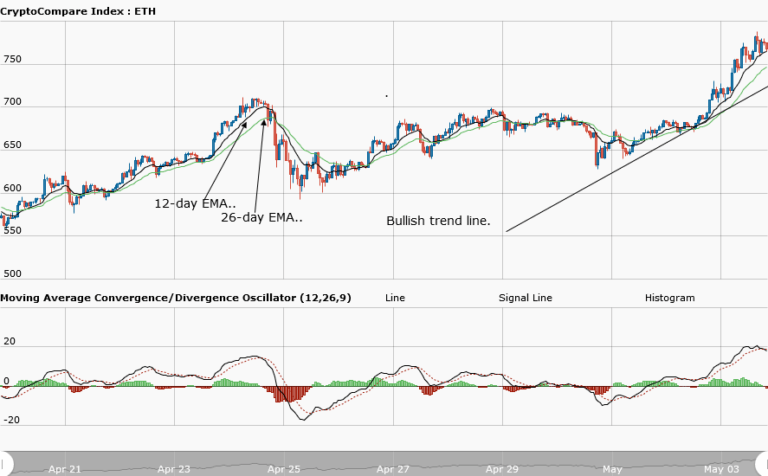
The 12-day EMA is above the 26-day EMA and is trending northward. The MACD line and the signal line are above the zero line which indicates that the asset is in a bullish trend. The price bars are above the 12-day EMA and 26-day EMA indicating that the current trend is ongoing. Ethereum is now free and is out of the range-bound zone of $700 and $650. Price of the asset is expected to reach the highs of $800 and $900.
ETHUSD Short-term trend: Bullish

In the daily chart, price of Ethereum is in a smooth uptrend. The price of the asset is making a series of higher highs and higher lows. The bullish trend line shows the support levels of price where traders can place their long trades. As the bullish market progresses, price may retrace from the recent high and touch the trend line. All the retracements or pullbacks on the trend line are buying setups for traders to initiate long trades.
The views and opinions expressed here do not reflect that of CryptoGlobe.com and do not constitute financial advice. Always do your own research.


