

ETHUSD Medium-term Trend: Ranging
Resistance: $630, $620, $610
Support: $570, $580, $590
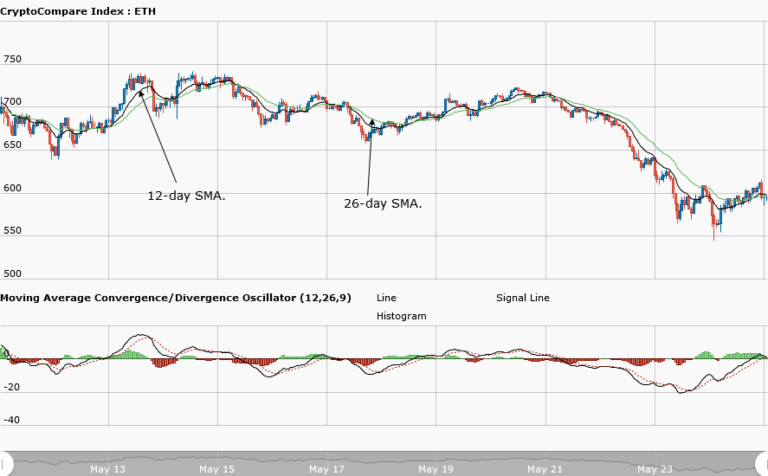
Yesterday, May 24, was the third day of an ongoing bearish trend. The asset fell to a low of $570 and it was assumed that if the downtrend continued, the price of Ethereum would reach a low of $500. Yesterday, the MACD line and the signal line were below the zero line, indicating a sell signal, whereas the 12-day EMA and the 26-day EMA, which were above the price of Ethereum, indicated that the bearish trend was ongoing.
Ethereum is currently trading at $597.27. Today is the fourth day of the ongoing bearish trend, but from the price action it may also be the first day of a bullish trend. The action showed that the asset once again fell to $550, but made a pullback above that level and went into consolidation. Ethereum managed to trade above $600.
However, the MACD line and the signal line are still below the zero line indicating a sell signal. Traders should ignore the sell signal because the bearish pressure is over.
ETHUSD Short-term trend: Bullish

On the daily chart, the price of Ethereum is now in a bullish trend. The asset fell from a high of $600 to a low of $550. Ethereum has once again made a bullish movement targeting the $600 mark.
The views and opinions expressed here do not reflect that of CryptoGlobe.com and do not constitute financial advice. Always do your own research.


