

ETHUSD Medium-term Trend: Bearish
Resistance: $670, $660, $650
Support: $610, $620, $630
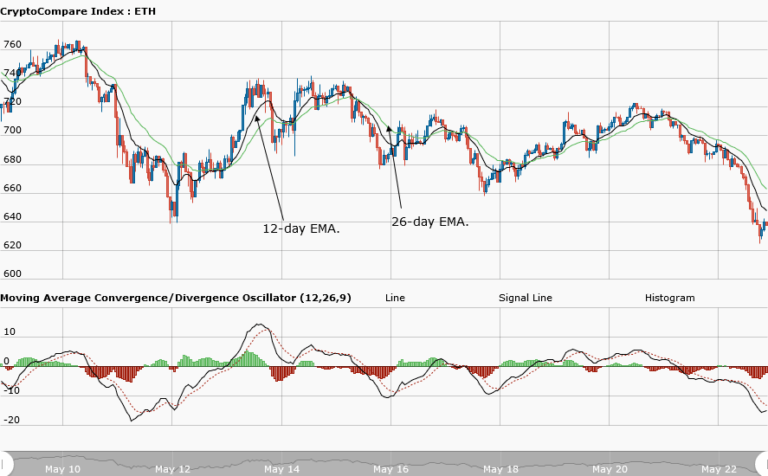
Yesterday, the ETHUSD pair was in a bearish market. The asset fell from the high of $720 to the low of $685. The asset was presumed to face resistance at $660, if Ethereum continued with its fall. Yesterday, the MACD line and the signal line were below the zero line which indicated a sell signal. As at yesterday, the 12-day EMA and the 26-day EMA were above the price of Ethereum which indicated that the bearish trend was ongoing.
Ethereum is currently trading at $637.80 as at the time of writing.From the weekly chart, Ethereum has entered the second day of its downtrend. The support level at $660 was broken and the price fell to the low of $637.80. However, the MACD line and the signal line are still below the zero line indicating a sell signal. The bearish trend is ongoing as indicated by the 12-day EMA and the 26-day EMA which are above the price of Ethereum.
ETHUSD Short-term trend: Bearish

On the daily chart, the price of Ethereum is in a smooth downtrend. The price of the asset has continued its fall to the low of $630. However, it made a pullback after the resistance at the support of $630. That is the reason the MACD line and the signal line are above the zero line indicating a buy signal.
The views and opinions expressed here do not reflect that of CryptoGlobe.com and do not constitute financial advice. Always do your own research.


