
EOSUSD Medium-term Trend: Bullish
Supply levels: $14.0, $13.5, $13.0
Demand levels: $11.0, $11.5, $12.0
The EOS price was in a bearish market. On 28 May, the asset fell from $11.6 to $10.80 but immediately started a bullish movement. Today, the asset was trading at $12.25 at the time of writing. The weekly chart shows that the asset in a bullish trend, breaking the resistance level at $12. The asset may reach $15 but may face resistance at $14.
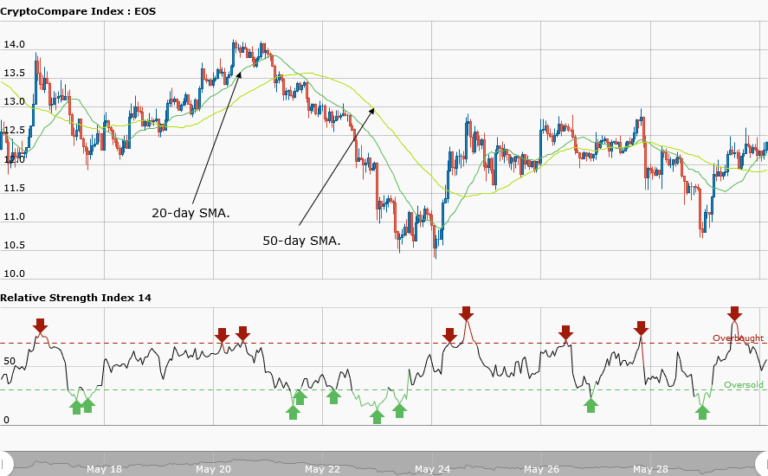
Meanwhile, the relative strength index period 14 is level 56, indicating that the price is in a range-bound zone.
EOSUSD Short-term Trend: Ranging

The daily chart shows the EOS price is in a range-bound movement. The asset rose from $10.5 to $12.5. EOS is now fluctuating from $12.5 to $12 in a horizontal pattern. The 20-day and 50-day moving averages are trending in a ranging pattern. This indicates that the asset price will lead to an eventual breakout.
The views and opinions expressed here do not reflect that of CryptoGlobe.com and do not constitute financial advice. Always do your own research.