

BTCUSD Medium-term Trend: Ranging
Resistance: $9,400, $9,350, $9,300
Support: $9,100, $9,150, $9,200
Yesterday, May 2, price of BTCUSD pair was almost the same price the previous day. Nevertheless, traders were advised to hold their long trades above the $9,000 and put a stop loss below the support level at $8,500. This is because if Bitcoin falls, it will find support at $8,700. Also, that they should put their take profits near the resistance zone at $9,500.
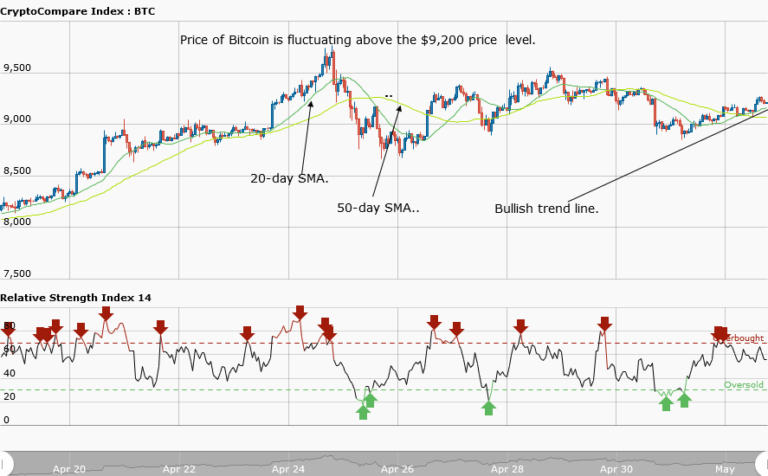
This is because if price of the asset does not rally above the resistance level, it will fall. Today, price of Bitcoin is currently trading at $9,213.22 as at the time of writing. However, from the weekly chart, the BTCUSD pair has not made any significant movement for the third day. Price is hovering above the $9,000 price level. We are expecting the bulls to break the resistance level at $9,500; then price will rally at the highs of $10,500 and $11,000.
Meanwhile, the relative strength index period 14 is level 55 which indicates that price is in the range bound zone.
BTCUSD Short-term Trend: Ranging

In the daily chart, price of Bitcoin has a bullish movement. The price of the asset rose from the low of $9,050 and commenced a bullish movement to the high of $9,250. Then at the price of $9,250 it commenced a range bound movement.
The views and opinions expressed here do not reflect that of CryptoGlobe.com and do not constitute financial advice. Always do your own research.


