

BTCUSD Medium-term Trend: Ranging
Resistance: $7,900, $7,800, $7,700
Support: $7,300, $7,400, $7,500
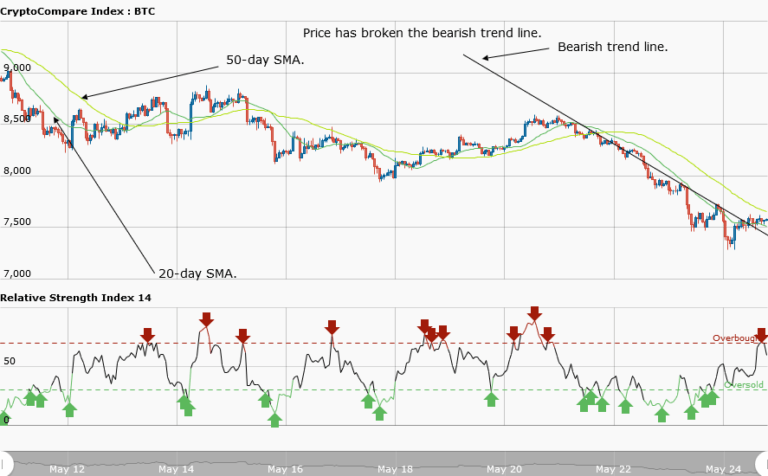
Yesterday, May 24, a bearish breakout occurred, and took Bitcoin’s price down to a low of $7,500. It was not certain whether the decline had ended, and that was why a trend line was drawn to determine the end of said trend. However, if the downtrend continued the asset would fall to lows of $7,000 or $6,600. Bitcoin is currently trading at $7,472.80.
Today, from the weekly chart, the price of Bitcoin fell to a low of $7,350 before making a pullback to over $7,450. Bitcoin is consolidating at the $7,500 area. A bearish trend line is drawn across the asset’s graph, and its price has broken it. The latest candles are closing on the opposite side of the trend line.
Now, as a result, the price is consolidating at the $7,500 level and breaking the bearish trend line. We can assume that the bearish trend is over. Traders can now take long positions at the $7,500 price level and place their stop loss below the $7,350 mark.
BTCUSD Short-term Trend: Ranging

On the daily chart, Bitcoin’s price is in a range bound movement. The asset fell from a high of $7,700 to a low of $7,300. It now made a pullback above the $7,500 level. This action saw Bitcoin resume a range bound movement.
The views and opinions expressed here do not reflect that of CryptoGlobe.com and do not constitute financial advice. Always do your own research.


