

BTCUSD Medium-term Trend: Bullish
Resistance: $8,650, $8,600, $8,550
Support: $8,350, $8,400, $8,450
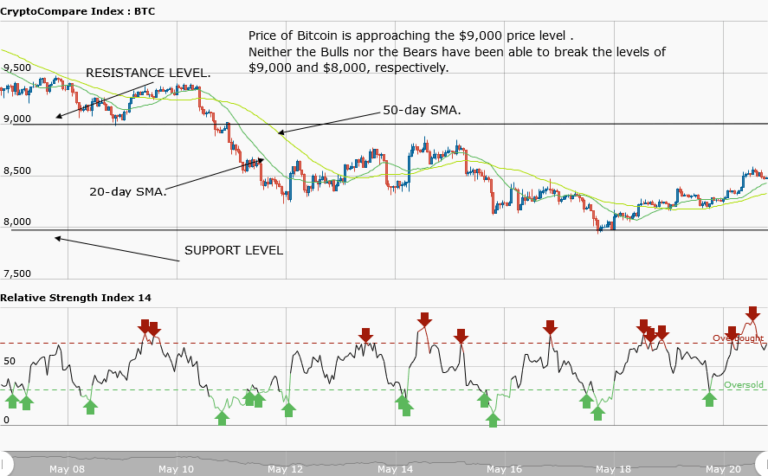
The BTCUSD pair had a bearish outlook throughout last week. The asset’s price was ranging from the $9,000 to the $8,000 level. It was assumed was that if the pair broke the support level at $8,000, the asset would fall lower to $7,000 or $6,685. However, the support level was not broken and the cryptocurrency’s price didn’t fall. BTC sustained its price above $8,000 all throughout last week.
BTC is trading at $8,519.75 at press time. From the weekly chart, the price of Bitcoin has appreciated from Friday’s low of $8,009 to $ 8,519, and is now approaching the $9,000 mark. The asset has been range bound between the levels of $8,000 and $9, 000, since May 12. Bitcoin may likely face resistance at $8,500, but if the bulls overcome that hurdle the price will reach a high of $9,000.
BTCUSD Short-term Trend: Bullish

On the daily chart, the price of Bitcoin is rising. Both the 20 and 50-day SMA are trending northward confirming the cryptocurrency’s rise. It managed to reach a high of $8,500 and is facing resistance at that level. Instead of the price breaking through that level, the asset is in a range bound movement.
The views and opinions expressed here do not reflect that of CryptoGlobe.com and do not constitute financial advice. Always do your own research.


