
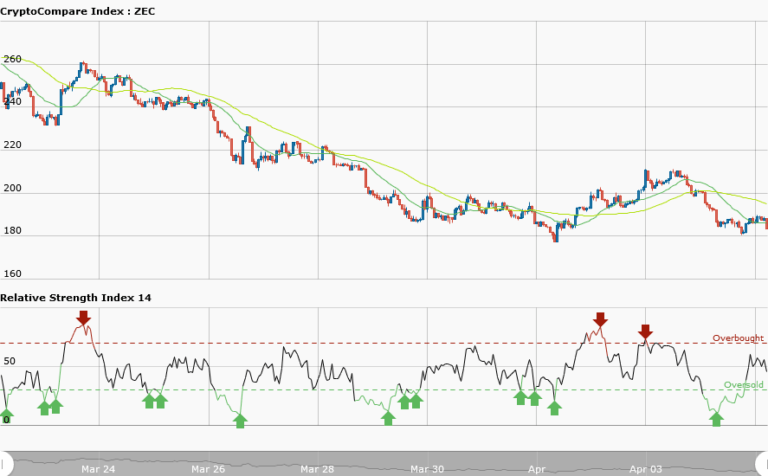

ZECUSD Medium-term Trend: Bearish
Supply levels: $200, $195, $190
Demand levels: $170, $175, $180
The overall trend of ZECUSD pair is bearish, though the market is ranging lately. From the weekly chart, price of ZCash was in a bullish outlook on April 4, 2018. The bulls took the price above the resistance level at $200 and lost control to the bears who took price to its present low at $186. Since then price has been in a range bound movement, without the control of either the bulls or the bears.
However, the RSI period 14 is level 45 which indicates that price is in the range bound zone. The range bound movement may continue for some time.
ZECUSD Short-term Trend: Ranging

In the daily chart, price of ZCash is in a range bound movement. Price of ZCash is fluctuating between the resistance at $195 and the support at $180. Price is moving horizontally between the key levels which make trading difficult. If the price between the resistance and support is very close then price is said to be choppy. However, the RSI period 14 is level 19 which indicates that the market is seriously oversold suggesting bulls taking control of the market.
The views and opinions expressed here do not reflect that of CryptoGlobe.com and do not constitute financial advice. Always do your own research


