

ZECUSD Medium-term Trend: Ranging
Supply levels: $210, $205, $200
Demand levels: $180, $185, $190
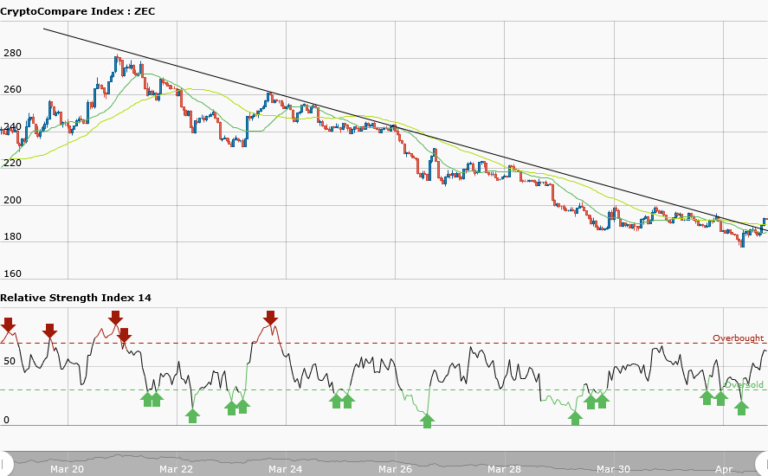
Last week, Price of ZCash was fluctuating between the resistance at $280 and the support at $220. On March 29, price broke the support level at $220 and fell to its low at $180. From the weekly chart, price of ZCash has broken the bearish trend line and the candlestick closed on the opposite of the trend line. This implies that the downtrend has ended and also it suggests that bulls may take control of the market.
The RSI period 14 is level 63 which indicates that price is in the bullish trend zone. The price is likely to break the resistance level at $200 and later push further to its previous level at $250. ZCash is currently trading at $198.74.
ZECUSD Short-term Trend: Ranging

Price of ZCash is fluctuating between the resistance level at $195 and the support level at $180. The RSI period 14 is level 83 which indicates that the market is overbought suggesting bears to take control of the market. The RSI diverges with price action but the warning is that reversal of price imminent.
The views and opinions expressed here do not reflect that of CryptoGlobe.com and do not constitute financial advice. Always do your own research


