
ZECUSD Medium-term Trend: Ranging
Supply levels: $185, $184, $183
Demand levels: $179, $180, $181
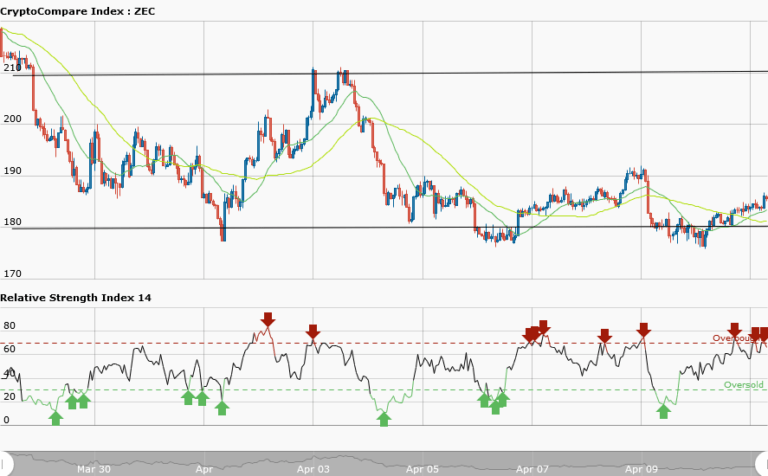
ZCash is trading at $185.19 in a ranging market. However, ZCash price is oscillating between the resistance level at $210 and the support level at $180. Meanwhile, the RSI period 14 is level 71, which indicates that the market is overbought, suggesting bears to take control of the market. The RSI indicator diverges with price action. The price of the asset is at the support zone, not yet overbought.
What we can take from the RSI indicator is that the price reversal is imminent. ZCash price is expected to rise and test the resistance level.
ZECUSD Short-term Trend: Ranging

ZCash price is in a bullish trend. In the daily chart a bullish trend line is drawn, showing the price support levels, where traders can place their long trades. As the trend progresses, look out for buy setup along the trend line where you can place your long trades. You can exit your open positions as soon as the price breaks the bullish trend line and the candlestick closes on the opposite side of the trend line.
The views and opinions expressed here do not reflect that of CryptoGlobe.com and do not constitute financial advice. Always do your own research