

XRPUSD Medium-term Trend: Bearish
Supply Levels: $0.52, $0.51, $0.50
Demand levels: $0.46, $0.47, $0.48
Yesterday, Ripple was in a bullish outlook when it traded to the previous level at $0.53. But the bulls could not sustain hold on that level until the bears took price to the low at $0.48. Ripple, is presently trading at $0.49 as at the time of writing. Ripple price at $0.48 is the lowest level it had fallen since the beginning of this year and late last year. Secondly, that level had been tested for more than two occasions; therefore it is a strong support.
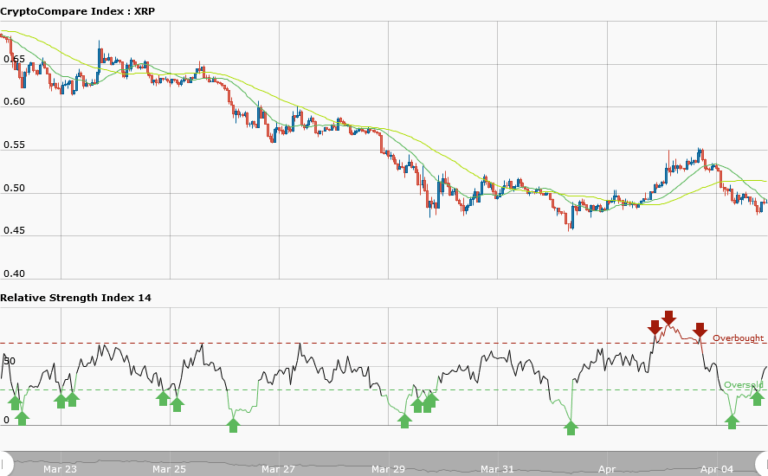
Nevertheless, I expect the bulls to push price beyond the resistance at $0.50. Meanwhile, the RSI period 14 is level 47 which indicates that price is in the range bound zone.
XRPUSD Short-term Trend: Ranging

The daily chart explains how the bears took price from the bulls to its low at $0.48. Yesterday the bulls had earlier taken price from the support at $0.48 to $0.53 before they were over powered by the bears. Since price at $0.48 is a strong support, I expect price to rise. Traders should look out for buy setups to form. However, the RSI period 14 is level 46 which indicates that price is the range bound zone.
The views and opinions expressed here do not reflect that of CryptoGlobe.com and do not constitute financial advice. Always do your own research


