

XRPUSD Medium-term Trend: Bullish
Supply Levels: $1.10, $1.00, $0.90
Demand levels: $0.50, $0.60, $0.70
Ripple price is in a smooth uptrend, trading at $0.87 at the time of writing. Yesterday, one of the key resistance at $0.70 was broken which made the price go up. The traders were advised to place long trades at the market’s support level when the price reached $0.71. If you opened those long trades, you should be at the current market price of $0.87.
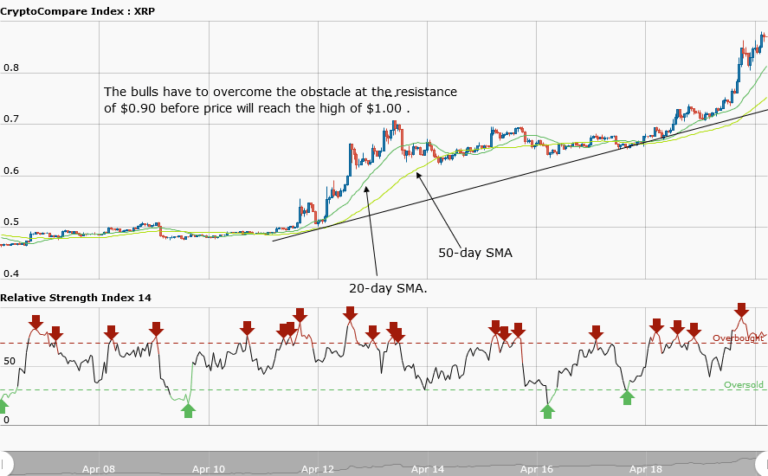
However, in the weekly chart, Ripple price is likely to reach the $1.00 high, but it has to overcome the resistance at $0.90. In February 2018, the $0.90 price was a key support level before being broken by the bears. The price has been consolidating at that level before a bearish breakout occurred. Today, the $0.90 price is a resistance level which the bulls have to break for it to reach the $1.00 high.
XRPUSD Short-term Trend: Bullish

In the daily chart, Ripple price is in a smooth uptrend when traders can buy low and sell high. Also, as the price makes a series of higher highs and higher lows, traders can place long trades as the price retraces from the recent high to the support levels.
The views and opinions expressed here do not reflect that of CryptoGlobe.com and do not constitute financial advice. Always do your own research.


