
LTCUSD Medium-term Trend: Ranging
Resistance: $120, $118, $116
Support: $108, $110, $112
Last week, the LTCUSD pair had no clear direction of the market. Price of Litecoin was in a range bound movement. On Monday, April 2, price of Litecoin traded at $111.80 but ended the trading week with a price of $114.11. Today, the price of Litecoin is still the same. However, from the weekly chart, the LTCUSD pair is ranging in a horizontal pattern at the support level.
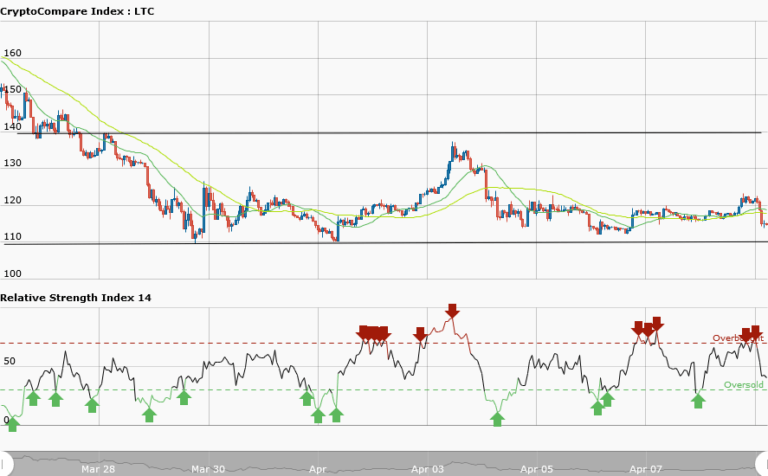
The RSI period 14 is level 42 which indicates that price is in the range bound movement. Price of Litecoin may continue its range bound movement this week.
LTCUSD Short-term Trend: Ranging

In the daily chart, price of Litecoin was ranging at $118, but rose to $122 before the bears took it to its present low at $114. However, if the bulls fail to hold price at the support level, price may fall to its low at $110. Nevertheless, if price falls to its low at $110; then traders should look out for buy setups in the event of a bullish trend.
The views and opinions expressed here do not reflect that of CryptoGlobe.com and do not constitute financial advice. Always do your own research


