

LTCUSD Medium-term Trend: Bearish
Resistance: $135, $130, $125
Support: $105, $110, $115
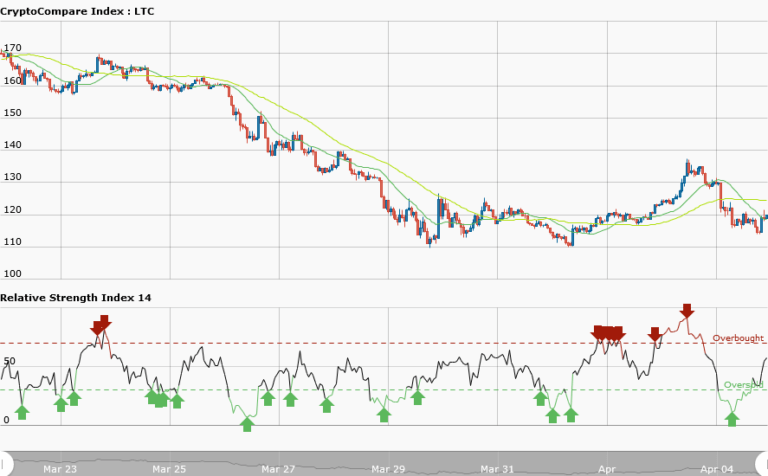
Yesterday, LTCUSD pair was in a bullish trend and price reached the previous level at $132.77. However, the bears took the price from the bulls to the low at $115. But it is currently trading at $119.22, as at the time of writing. The resistance at $120 had been a critical zone for the price of Litecoin. Either the bears are breaking the level now, or the bulls will take control of the market later.
Since it was the bears that took the price to the support at $110; it is assumed that the bulls will take control at the support level. I expect the bulls to take the price beyond the resistance at $120. Meanwhile, the RSI period 14 is level 57 which indicates that price is in the range bound zone.
LTCUSD Short-term Trend: Ranging

In the short term trend, price of Litecoin is ranging between the resistance at $130 and the support at $115. Price fell from $130 and it was moving horizontally at $115. Although, the support levels of $105, $110 and $115 had been breached; price is expected to rise. However, the RSI period 14 is level 45 which indicates that price is in the range bound zone.
The views and opinions expressed here do not reflect that of CryptoGlobe.com and do not constitute financial advice. Always do your own research


