

LTCUSD Medium-term Trend: Bullish
Resistance: $170, $168, $164
Support: $156, $158, $160
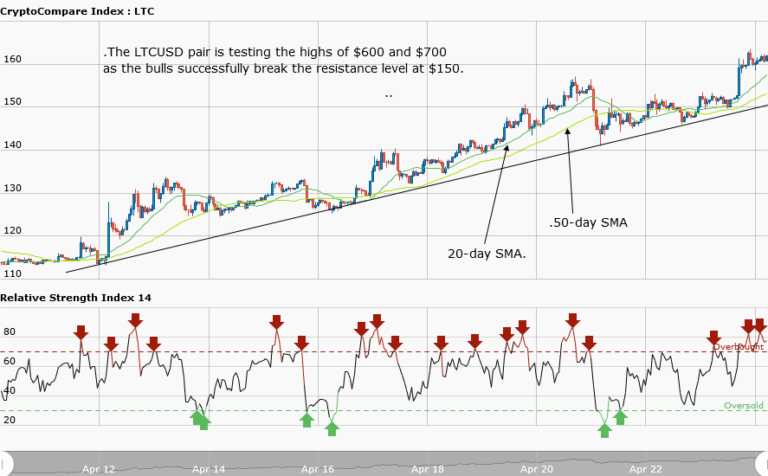
Yesterday, the LTCUSD pair was trending northward in a bullish market. The price was expected to reach $160 and traders to place long trades at the $150 support level, with a stop loss at $140. There was a large bullish candlestick from the $150 support that made the price reach $160. However, traders are making use of the bullish trend line in a smooth uptrend.
Today, Litecoin is trading at $161.94. Nevertheless, the relative price index period 14 is level 75, which indicates that the market is overbought, suggesting the bears will take control of the market. If this happens, the price will fall to $150.
However, if the price rallies at the overbought market conditions, the bulls may push it to the next level.
LTCUSD Short-term Trend: Ranging

In the daily chart, the Litecoin price is in a range bound movement. At $152, Litecoin was in a range bound movement before it rose to $160. Even at that price, it fluctuates to the level of $162.
The views and opinions expressed here do not reflect that of CryptoGlobe.com and do not constitute financial advice. Always do your own research.


