
LTCUSD Medium-term Trend: Bullish
Resistance: $150, $145, $140
Support: $120, $125, $130
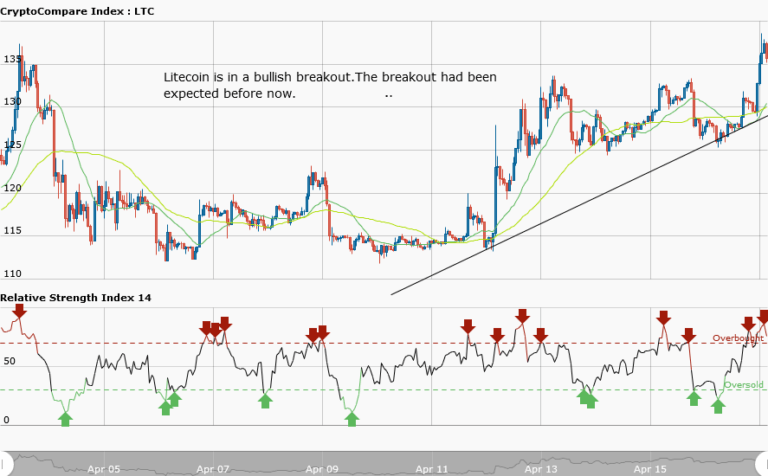
The LTCUSD pair is in a bullish breakout. This probably is the third time the price will be breaking the resistance at $130. However, the first two times the price broke the resistance level, but retraced back to the resistance zone. From the weekly chart, a bullish trend line is drawn, showing the support levels where traders can place their long trades. If the price of an asset retraces from the recent high to the support level of the trend line, that could be taken as a buy setup.
On the other hand, if price retraces from the recent high to break the trend line, then you can exit your trades. Litecoin is currently trading at $135.66. However, if the bulls can hold on to the price and push again, the $140 and $150 price levels will be achieved.
LTCUSD Short-term Trend: Bullish

In the daily chart, Litecoin price was range bound at $128. Initially, it broke the resistance at $130, but it pulled back into the resistance zone. It finally broke the resistance within days of trial and went up to the price level at $138. Meanwhile, the RSI period 14 is level 24, which indicates that the market is oversold, suggesting bulls are taking over the market.
The views and opinions expressed here do not reflect that of CryptoGlobe.com and do not constitute financial advice. Always do your own research.


