

LTCUSD Medium-term Trend: Ranging
Resistance: $131, $130, $129
Support: $125, $126, $127
The LTCUSD pair has been in a range bound movement for over two weeks. It broke out from the range bound zone, only to fall back to the range again.
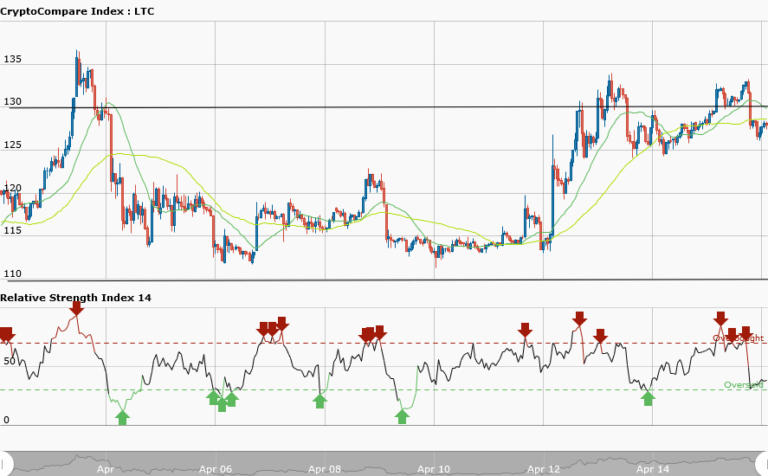
The bulls and the bears have confined themselves to the support at $110 and the resistance at $130. Presently, Litecoin is trading at $127.84. However, judging from the weekly chart, the bulls have exhausted their bullish move. The price may fall to its previous low at $114. However, the RSI period 14 is level 38, which indicates that the market has reached its oversold market condition, suggesting the bulls will take control of the market.
LTCUSD Short-term Trend: Ranging

In the daily chart, Litecoin price reached its peak during the bullish trend at $133 and later fell to its low at $127. Litecoin may continue its range bound movement this week, as the bulls and the bears have no control of the market, with the price fluctuating between the resistance at $130 and the support at $110. If the price falls to the low of $110, traders should look for buy setups.
The views and opinions expressed here do not reflect that of CryptoGlobe.com and do not constitute financial advice. Always do your own research.


