

ETHUSD Medium-term trend: Bearish
Resistance: $410, $400, $390
Support: $350, $360, $370
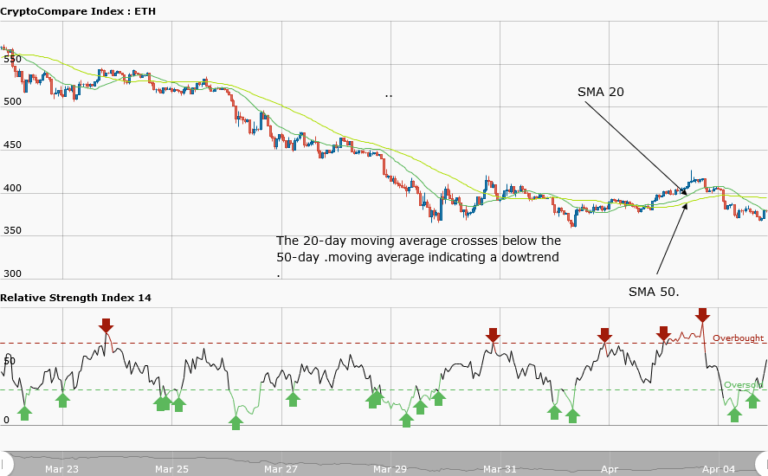
On April 4, 2018, the Bulls took the price of Ethereum to $415 but could not hold at the critical level of $400. Today, the price of Ethereun has a bearish outlook because the 20-day moving average crosses below the 50-day moving average. However, the bears are holding on the price at $381.40 as at the time of writing. Since December 2017, price at $400, either below or above it, had been a critical zone.
From the weekly chart, price of Ethereum at $381.40 is in the range bound zone. That is, price will be fluctuating between the resistance at $390 and the support at $350. It is said that history sometimes will repeat itself. Price will range in these confined levels until a breakout will ensue. Meanwhile, the RSI period 14 is level 44 which indicates that price is in the range bound zone.
ETHUSD Short-term trend: Ranging

In the daily chart, price of Ethereum is in the range bound movement. It is oscillating between the resistance at $390 and the support at $370. The daily chart has a choppy price action. Price of Ethereum is moving horizontally and it is not evenly apart between the resistance and the support. It is therefore not advisable to trade the asset. Meanwhile, the RSI period 14 is level 79 which indicates that the market is overbought suggesting bears to take control of the market.
The views and opinions expressed here do not reflect that of CryptoGlobe.com and do not constitute financial advice. Always do your own research.


