

ETHUSD Medium-term Trend: Bullish
Resistance: $590, $580, $570
Support: $530, $540, $550
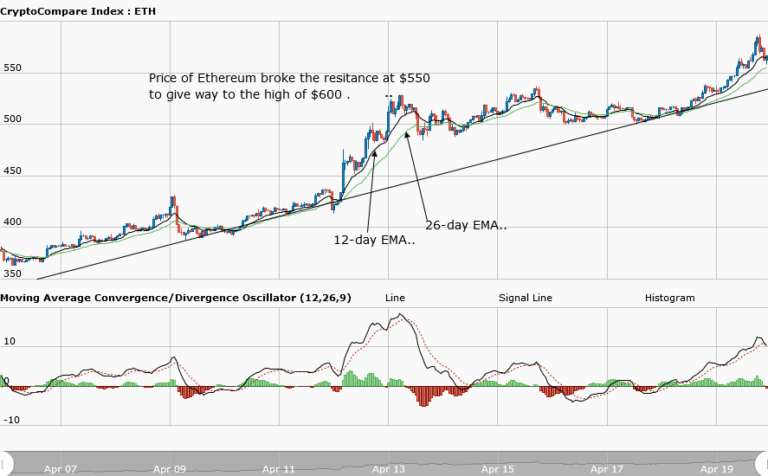
Yesterday, April 19, the price was expected to break the resistance level at $550 so that Ethereum will reach the high of $600. Today, Ethereum price broke the resistance level at $550 and it is currently trading at $564.42. However, from the weekly chart, the price is still in a bullish market. From the indices we have on the chart, the MACD line and the signal line are above the zero line.
You can see the negative histogram turning to a positive histogram. Also, the price bars are above the 12-day and 26-day EMA. All these factors are responsible for the bullish nature of the market. There is a common saying that the trend is your friend. You should trade along with the trend by utilizing the bullish trend line in our trading.
You can also wait for price retracement before initiating any order. As the price is making a series of higher highs and higher lows, you will find the higher lows on the trend line. Then you can initiate your long trades with stop loss orders below the trend line.
ETHUSD Short-term trend: Bearish

In the daily chart, the Ethereum price has a bearish outlook. From the chart, you can see that the price broke the $550 resistance level, but was resisted at $587. The bulls could not reach $600 before they were stopped by the bears. However, the MACD line and the signal line are below the zero line, indicating a bearish signal.
The views and opinions expressed here do not reflect that of CryptoGlobe.com and do not constitute financial advice. Always do your own research.


