

ETHUSD Medium-term Trend: Bullish
Resistance: $550, $545, $540
Support: $520, $525, $530
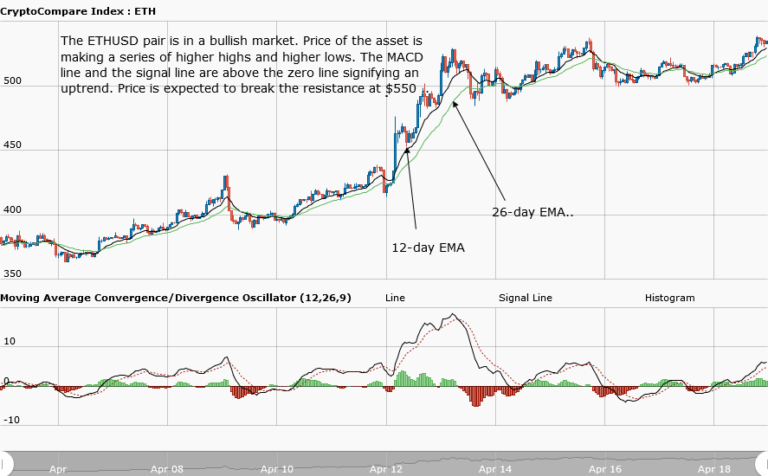
Yesterday, Ethereum price was in a ranging market. The price was resisted at $536, then fell to the $500 level and began a range bound movement. The price was oscillating between the support at $500 and the resistance at $550. Today, Ethereum is in a bullish market, trading at $531.78 at the time of writing. However, from the weekly chart, the MACD line and the signal line are above the zero line.
Also, the MACD line crosses above the signal line. In addition, the asset price must be above the 12-day and 26-day EMA. This information will enable the trader to look for buy setups, to place long trades. The Ethereum price is expected to break the resistance level at $550, so that it will reach $600 and another price level.
ETHUSD Short-term trend: Bullish

In the daily chart, the ETHUSD pair began its uptrend movement at $515 and pulled back to $510. The 12-day EMA is above the 26-day one, indicating that Ethereum price is rising.
The views and opinions expressed here do not reflect that of CryptoGlobe.com and do not constitute financial advice. Always do your own research.


