

ETHUSD Medium-term Trend: Bearish
Resistance: $460, $440, $420
Support: $340, $360, $380
Yesterday, the ETHUSD pair was bullish according to the MACD indicator. The MACD line and the signal line were above the zero line. Also, price of Ethereum was above 12-day EMA and 26-day EMA. All were pointing to the fact that Ethereum was bullish yesterday.
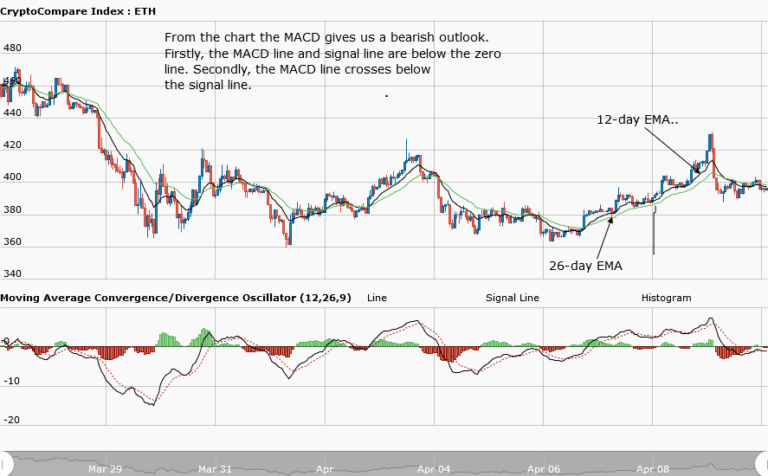
Today, Ethereum was trading at $395.44, at the time of writing. However, from the weekly chart, the MACD indicator gives us the impression that the Ethereum price is bearish because of the following findings: firstly, it states that the 12-day EMA crosses below the 26-day EMA; secondly, the MACD line and signal line are below the zero line; thirdly, the MACD line crosses below the signal line.
However, these facts are to be used in conjunction with price action, in order to avoid false signals. The Ethereum price was actually bullish yesterday, but bulls lost possession to the bears that brought the price to $391. The Ethereum price may continue its range bound movement for now.
ETHUSD Short-term trend: Ranging

In the daily chart, price action shows that Ethereum price is in a range bound movement. However, from the chart, the MACD line and signal line are very close to each other because the market is in a range bound movement the Ethereum price is losing strength.
The views and opinions expressed here do not reflect that of CryptoGlobe.com and do not constitute financial advice. Always do your own research.


