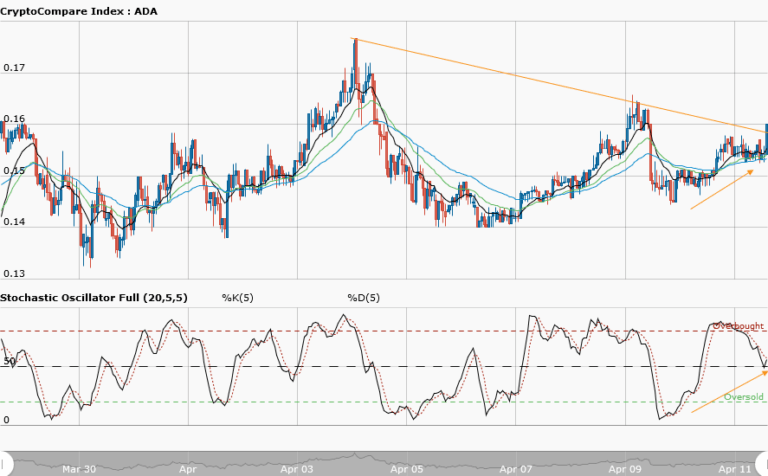
ADAUSD Medium-term Trend: Bullish
Supply zones: $0.280, $0.300, $0.320
Demand zones: $0.180, $0.160, $0.140
The medium-term bias is still bullish for Cardano. The daily candle opened with $0.2611, within the exponential moving averages (buying area). This was higher than yesterday’s open of $0.2419, meaning more buyers are in the market. The bulls drove the price up to the supply zone at $0.2756 earlier today. This created a nice double top formation. Cardano got to this supply zone on April 17th, before the sellers set in. The bears are doing the same in the market now and they are set to push the price down. This is to be expected, but not going to last for long. The moving averages will act as critical demand areas for a reversal to the upside. The price is forming higher highs and higher lows which are synonymous with the uptrend scenarios. The Stochastic Oscillator is in the overbought area, showing a downward momentum due to the double top formation, but this will likely be rejected before or at the 50 percent level, when the buyers stage a comeback.
ADAUSD Short-term Trend: Ranging
Cardano is still ranging in the short term. It managed to break the supply area at $0.260 yesterday and pushed to the supply area at $0.2755 earlier today. This is still within the range analyzed yesterday ($0.275-$0.240). The demand area at $0.260 is strong, as we see the bullish comeback. As long as price does not break down in this area, we are definitely going to see a breakout to the upside from this demand zone soon. More candles should form and close above the three exponential moving averages to confirm the breakout and a progressive move to break out of the high range of $0.275. Traders could take advantage and buy low, as the overall outlook is bullish.
The views and opinions expressed here do not reflect that of CryptoGlobe.com and do not constitute financial advice. Always do your own research.


