

BTCUSD Medium-term Trend: Ranging
Resistance: $7,200, $7,100, $7,000
Support: $6,500, $6,600, $6,700
The overall trend of BTCUSD pair was bearish throughout last week. The range bound movement continued until the support level was broken on Friday 30, 2018 which left price to its low at $6,700.68. Today, Bitcoin is trading at $6.971.27 as at the time of writing.
From the weekly chart, price of Bitcoin had broken the bearish trend line and the candlestick closed on the opposite of the trend line. The implication of price breaking the trend line is that the downtrend is over. Price will no longer test the support level of $6,500 but may re-test its previous level of $7500 for now. However, the RSI period 14 is level 57 which indicates that price is in the range bound zone.
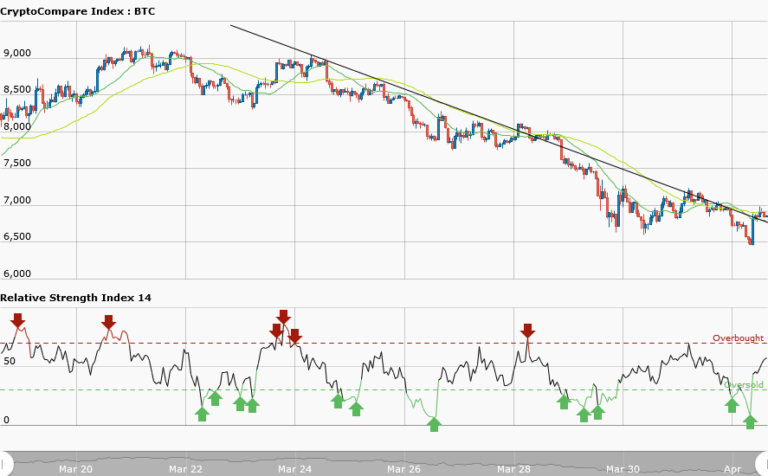
BTCUSD Short-term Trend: Ranging

In the daily chart, you will see the support level at $6,500 where price got stalled and the eventual reversal of the downtrend. Price of Bitcoin is ranging between the support at $6,500 and the resistance at $7,000. Another breakout is expected at the resistance level of $7,500 after the range bound movement. However, the RSI period 14 is level 27 which indicates that the market is oversold suggesting bulls taking control of the market.
The views and opinions expressed here do not reflect that of CryptoGlobe.com and do not constitute financial advice. Always do your own research.


