

ZECUSD Medium-term Trend: Bearish
Supply levels: $385, $380, $375
Demand levels: $355, $360, $365
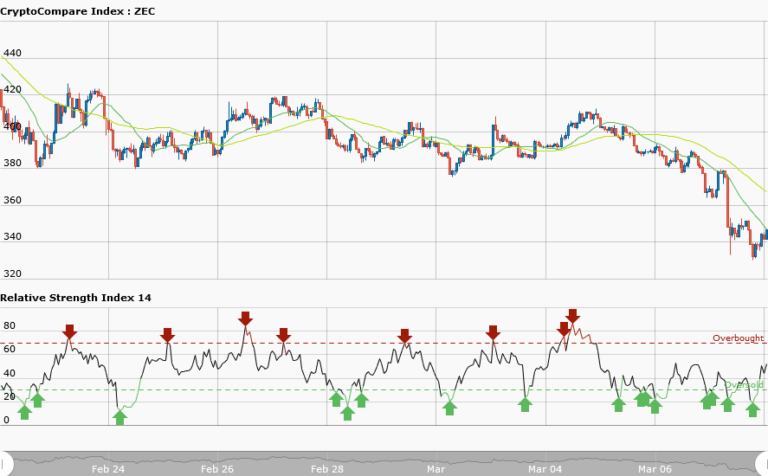
Yesterday, the market was on a sideways movement and later the price fell from $380 to $335. It is currently trading at $342.69. The price of ZCash is expected to rise today because it has reached the support level of the market. Traders can initiate a long order so as to catch the bullish trend at its inception. Meanwhile, the RSI period 14 is level 44 which indicates that the market is in the sideways trend zone.
ZECUSD Short-term Trend: Sideways

In the short term trend, the price fell from $380 to $335 and later commenced a sideways movement. The price is currently oscillating between the levels of $350 as the resistance level and $330 as the support level. It is not advisable to trade the sideways market because of the choppy price action. But if you must trade it you place a short order at the resistance and exit near the support zone.
Also, you place a long order according to the number of arrows and exit near the resistance zone. However, RSI period 14 is level 69 which indicates that the market is in the bullish trend zone.


