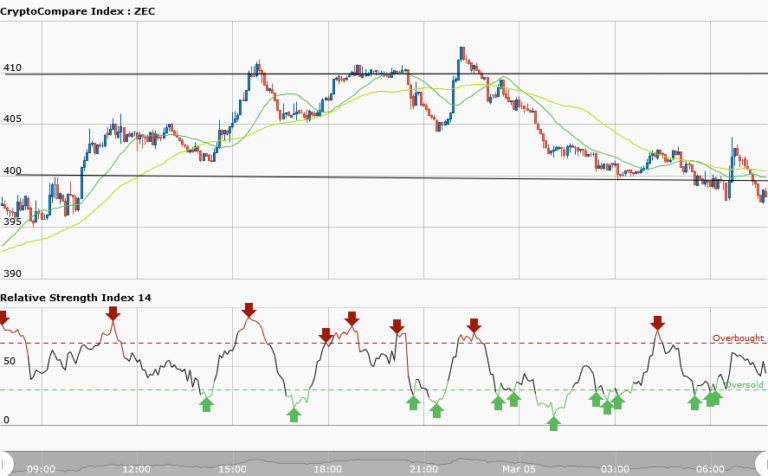

ZECUSD Medium-term Trend:Sideways
Supply levels: $415, $410, $405
Demand levels: $385, $390, $395
Last week the ZECUSD pair was trading between $390 and $405.It was either in a bearish market or in a sideways market. Today, Zcash price is trading at $397.88 and in a sideways market. From the daily chart, you can identify the key levels of the market but the sideways market has a choppy price action. The price at $410 is the resistance level while the price at $400 is the support level. Even though the key levels are even the market has a choppy price action.
Traders should suspend trading in a choppy market because of the risk of loss of capital.Meanwhile, the 50-day moving average and 20-day moving average are trending sideways whereas the RSI period 14 is level 54 indicates that the average gains are higher than average losses.
ZECUSD Short-term Trend: Bearish

In the short term trend, ripple price has a bearish outlook. In downtrend you short at the resistance when the price retraces from the low. The 50-day moving average and 20-day moving average are trending southward whereas the RSI period 14 is level 60 indicates that price is in the bullish trend zone.