

ZECUSD Medium-term Trend: Bearish
Supply levels: $205, $200, $215
Demand levels: $175, $180, $185
Price of ZCash fell to its lowest level since November, 2017 but it is currently trading at $186.94. From the weekly chart, the support level at $200 had been tested on many occasions; therefore the current price is likely to hold. Meanwhile, the RSI period 14 is level 29 which indicates that the market is oversold suggesting bulls taking control of the market.
The indicator confirms that the bears may have exhausted their selling pressure and may have to give way for the bulls. Traders are to exit their short trades because of the oversold market conditions.
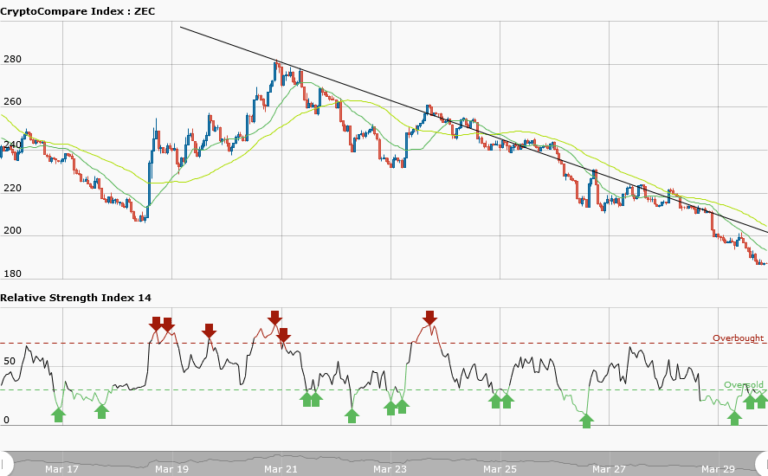
ZECUSD Short-term Trend: Bearish

The ZECUSD pair is in a downtrend with a bearish trend line showing resistance levels of price. At $186.94, price of ZCash commenced a range bound movement. Remember that when price is consolidating or in a range bound movement, your expectation is that a possible bounce is imminent. Our bearish trend line will determine if the price has reversed. That is if price breaks the trend line and the candlestick closed in the opposite of the trend line.
Then the downtrend is over and you can exit your short positions. The RSI period 14 is level 51 which indicates that price is in the range bound zone.
The views and opinions expressed here do not reflect that of CryptoGlobe.com and do not constitute financial advice. Always do your own research


