
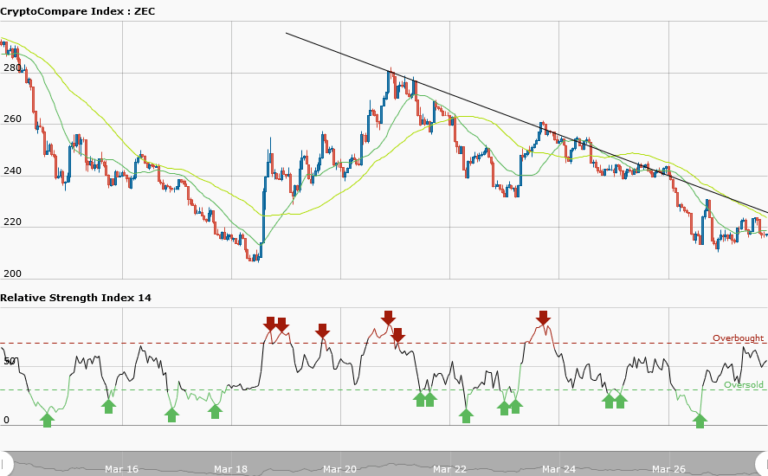

ZECUSD Medium-term Trend: Bearish
Supply levels: $230, $225, $220
Demand levels: $210, $215, $200
Yesterday, ZECUSD pair was in a ranging market. It was trading between the resistance at $280 and the support at $220. However, the support levels were broken which resulted to the bearish outlook. Presently, it is trading at $217.97. However, from the weekly chart, a bearish trend line is drawn showing the resistance levels of the downtrend.
The moving averages are trending southward confirming the downtrend. As a trader you have to wait for the price to retrace from the low to the trend line, and as price pulls back a resistance level would be created thereby giving traders the opportunity to short their trades. Meanwhile, the RSI period 14 is level 53 which indicates that price is the range bound zone.
ZECUSD Short-term Trend: Ranging

ZCash was in a downtrend yesterday, and price broke the support of $220 and the bears took the price to as low as $210. Later, price rose again to a range bound movement. Price is fluctuating between the resistance at $225 and the support at $215. This type of price action is not tradable because the price was moving horizontally and later in a range bound pattern.
Meanwhile, the RSI period 14 is level 55 which indicates that the price is in a range bound zone.
The views and opinions expressed here do not reflect that of CryptoGlobe.com and do not constitute financial advice. Always do your own research


