

ZECUSD Medium-term Trend: Bearish
Supply levels: $270, $260, $250
Demand levels: $210, $220, $230
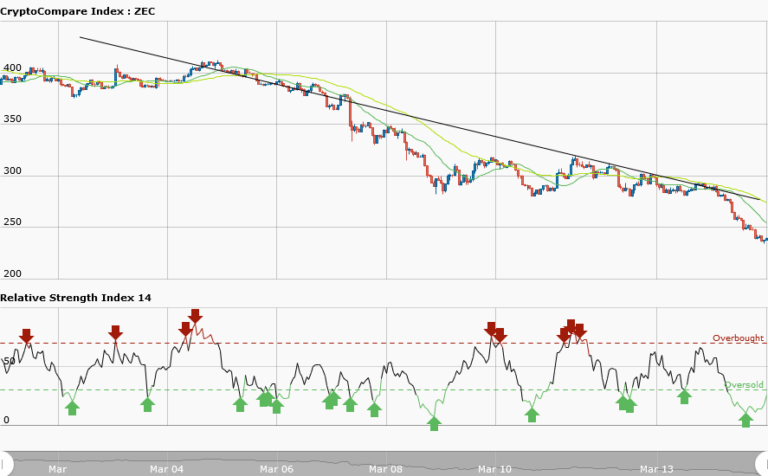
The ZECUSD pair had not been able to break the support level at $280 and resistance level at $320 for the past six days. Yesterday it was assumed that if the price breaks the support level it will fall to as low as $200. On the other hand if the price breaks the resistance level it will encounter resistance at $340. Today, the price of ZCash has fallen as a result of a breakout and it is currently trading at $239.15 as at the time of writing.
It is in a smooth downtrend from the top left hand corner and down to the right hand corner. It has a bearish trend line showing the resistance levels where traders can take short trades. Meanwhile, the RSI period 14 is level 25 which indicates that the market is oversold suggesting bulls taking over the market.
The bearish traders are to exit their positions because of the bulls who are taking control of the market.
ZECUSD Short-term Trend: Bearish

The daily chart shows ZECUSD pair in a smooth downtrend with bearish trend line showing the resistance where traders can take short trades. Meanwhile, the RSI period 14 is level 78 which indicates that the market is overbought. The RSI diverges with price action; that is, while price is going down the indicator is rising. This divergence explains that reversal in price is imminent.


