

XRPUSD Medium-term Trend: Sideways
Supply Levels: $0.96, $0.94, $0.92
Demand levels: $0.84, $0.86, $0.88
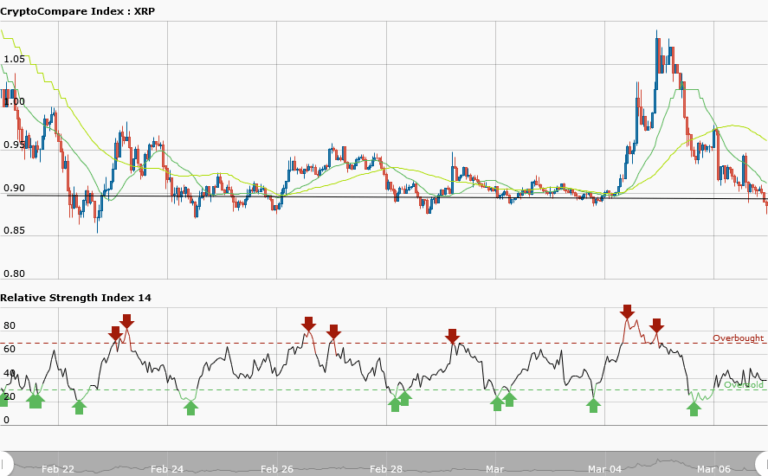
Yesterday, March 6, XRPUSD pair has a bearish outlook but today trading in a sideways market. It is currently trading at $0.89. Meanwhile, 50-day moving average and 20-day moving average are trending sideways whereas the RSI period 14 is level 37 which indicates that the market is tending to the oversold market condition.However, since ripple is in a sideways market its prospect of rising is very slim.
In a sideways market the market is neither going up nor going down rather the price will only be fluctuating. A good example is the price at $0.90 where the price has tested that key level a good number of times since February, 2018. It is unnecessary to place any trade.
XRPUSD Short-term Trend: Sideways

The short term trend is a sideways market. The market is sideways because the moving averages are trending horizontally. The candlesticks are almost on a straight line that makes trading difficult. The key levels of resistance and support are not evenly apart and the market has a choppy price action. That is the reason traders will always lose in a sideways market but wait for a market that is either bullish or bearish.


