

XRPUSD Medium-term Trend: Bearish
Supply Levels: $0.60, $0.59, $0.58
Demand levels: $0.54, $0.55, $0.56
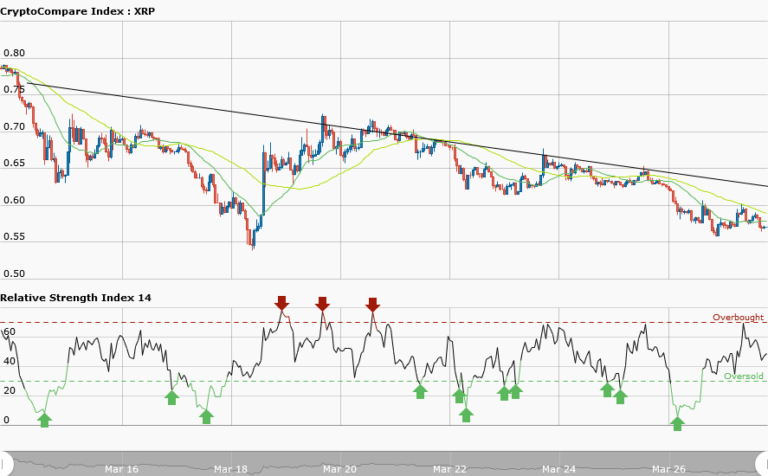
Ripple is in a smooth downtrend with a bearish trend line drawn across the price bars. The downtrend is confirmed by the 50-day moving average and 20-day moving average trending southward. As a trader, one thing I look forward to in a downtrend is a sell setup. If you look for buy setups you will be trading in the opposite direction of the bearish trend which is not advisable.
Now as the bearish trend progresses, price will likely retrace from the recent low towards the trend line and as price pulls back a resistance level is created; giving traders the opportunity to short their trades. Presently, Ripple is trading at $0.58. Meanwhile, the RSI period 14 is level 47 which indicates that price is in the range bound zone.
XRPUSD Short-term Trend: Ranging

Nevertheless, in the daily chart, price of Ripple is in a range bound movement. It is fluctuating between the resistance at $0.59 and the support at $0.56. Price is moving horizontally and later in a ranging pattern. However, the RSI period14 is level 56 indicates that price is in the range bound zone.
The views and opinions expressed here do not reflect that of CryptoGlobe.com and do not constitute financial advice. Always do your own research.


