

LTCUSD Medium-term Trend: Bearish
Resistance: $200, $195, $190
Support: $170, $175, $180
Yesterday I said that price of Litecoin might continue to fall until it gets to the price of $190. On the other hand if it rose it would encounter resistance at $200 . Also, if that level was broken then the price would soar higher to the level of $230. However, If the price of litecoin fell the support levels would be breached. Lite coin is currently trading at $185.48.The fact is that Litecoin has fallen to it’s low at $175 but it couldn’t break the resistance level of $200.
The price of lite coin may rise today because it has reached the support level. Traders can take a long trade so as to catch the bullish trend at its early stage . However, 50-day moving average and 20-day moving are trending southward.
LTCUSD Short-term Trend: Sideways

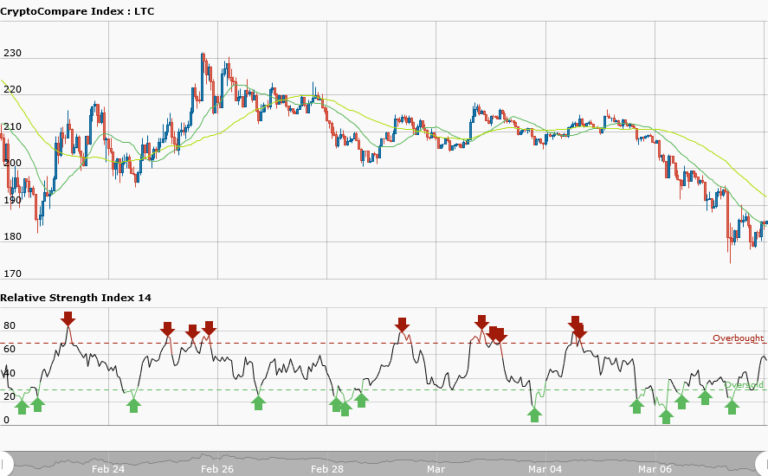
In the short trend, the price fell from $195 to $175 and commenced a sideways movement. The price is currently oscillating between the levels of $190 as the resistance level and $180 as the support level. It is not advisable to trade the sideways market because of the choppy price action. But if you must trade it then place a short order at the resistance and exit near the support zone.
Also, you place a long order according to the number of arrows and exit near the resistance zone.


