

LTCUSD Medium-term Trend: Bullish
Resistance: $164, $162, $160
Support: $152, $154, $156
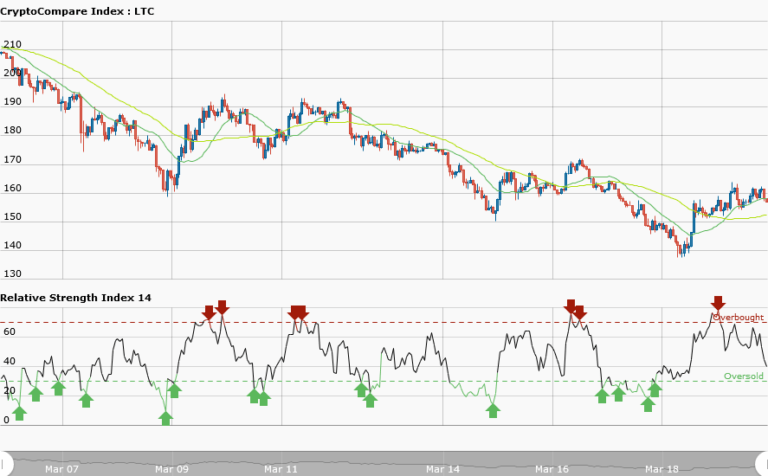
Yesterday, from the weekly chart, LTCUSD pair was in a downtrend with a bearish trend line showing resistance levels of price. The price of Litecoin broke the trend line which brought about the end of the downtrend. Today, the 20-day moving average is above the 50-day moving average which indicates that price is bullish. Presently, Litecoin is trading at $159.72. Also, the RSI indicator period 14 is level 40 which indicates that price is in range bound zone.
LTCUSD Short-term Trend: Ranging

From the daily chart, Litecoin is in a range bound movement. It tested the resistance at $162 for about four times and the support at $156 at other times and resumed its range bound movement. To trade this range bound movement, you take a short trade at the resistance and exit near the support zone. In the same vein, you take a long trade and exit near the resistance zone.
Your orders may be according to the number of arrows as the market oscillates along the key levels. Meanwhile, the RSI period 14 is level 31 which indicates that the market is oversold suggesting bulls taking over the market.


