

LTCUSD Medium-term Trend: Ranging
Resistance: $168, $166, $164
Support: $156, $158, $160
Yesterday, March 15, price of Litecoin broke the support level of $160 and fell to a low of $152.91. Yesterday, the RSI period 14 was level 21 which indicated that the market was oversold suggesting bulls taking control of the market. Bearish traders were also advised to exit their positions because of the oversold market condition.Today, from the weekly chart the price of Litecoin has retraced and broken the bearish trend line to establish another trend.
It is now in a range bound market and trying to consolidate at the resistance level of $160. It is currently trading at $162.69 and may continue the range bound market for some days. Meanwhile, the RSI period 14 is level 51 which indicates that the average gains are higher than average losses
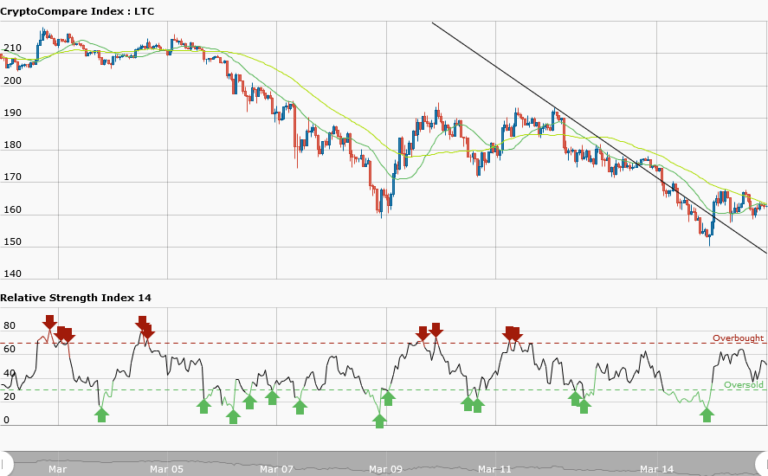
LTCUSD Short-term Trend: Ranging

Yesterday, March 15, Litecoin is in a smooth downtrend with a bearish trend line showing the resistance levels where a trader can place short trades. Today, it is in a range bound market with price oscillating between the resistance at $168 and support at $158. It has a choppy price action and therefore not tradable. Meanwhile, the RSI period 14 is level 40 which indicates that the price is in a range market zone.


