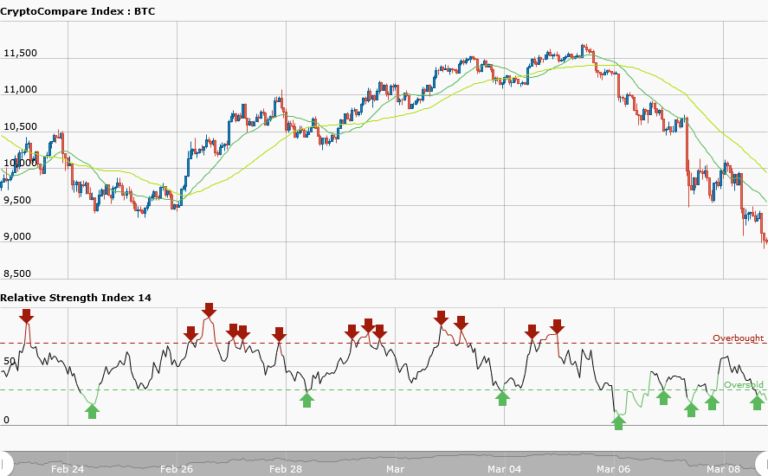
ETHUSD Medium-term Trend: Bearish
Resistance: $740, $720, $700
Support: $620, $640, $660
Yesterday, the price of ethereum was analyzed to have risen so that traders can place long orders to catch the trend at its early stage because the price has reached its support level. However, the market fell again from its yesterday’s low of $730 to $640 as result of negative news. Ethereum is currently trading at $679.14. However, the RSI period 14 is level 24 indicates that the market is oversold suggesting bulls takeover of the market. Traders should expect bullish orders today.
ETHUSD Short-term trend: Bearish
In the short term trend, the price that fell from $790 to $730 the previous day fell to as low as $640 today due to unauthorized sell off and negative news. Although, the daily chart do not show price consolidation but retracement and if the price falls again the demand levels would be breached. However, the 50-day moving average and 20-day moving average are trending southward.
While the RSI period 14 is level 60 which indicates that the price has reached the bullish trend zone. Traders should expect bullish orders today because the selloff is assumed to be over.


