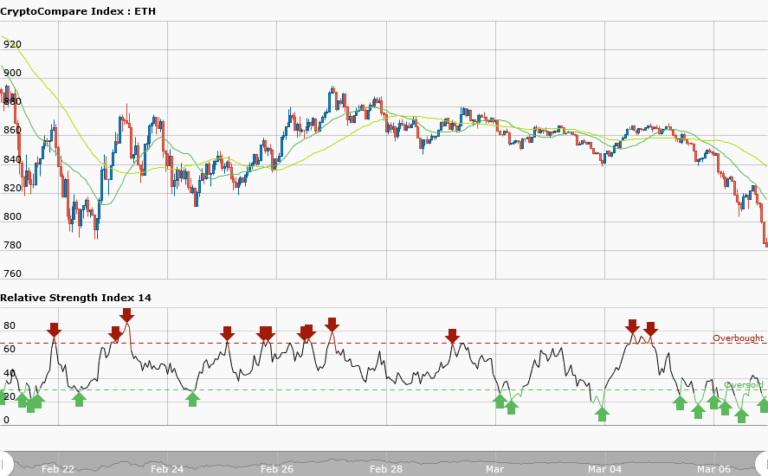
ETHUSD Medium-term Trend: Bearish
Resistance: $810, $800, $790
Support: $750, $760, $770
Yesterday, the ETHUSD pair was in a sideways movement but now has a bearish outlook. The price has fallen to $779.01 as at the time of writing. However, 50-day moving average and 20-day moving average are trending southward whereas the RSI period 14 is level 23 indicates that the market is oversold suggesting bulls to take control of the market. Ethereum price may continue to rally downward until it gets to the support level of $750.
On the other hand if it rises it will encounter resistance at $800 and if that level is broken then the price will soar higher. But if the price of ethereum falls the market will be breached.
ETHUSD Short-term trend: Bearish
In the short term trend, the daily chart has a bearish outlook. We have the daily chart showing price retracement from the low and creating opportunities for short trades. Meanwhile, 50-day moving average and 20-day moving average are trending southward whereas the RSI period 14 is level 28 indicating that the market is oversold. Since the market is faling traders should wait until the price gets to the support level of $750 before initiating a long trade.


