

ETHUSD Medium-term Trend: Bearish
Resistance: $490, $530, $520
Support: $430, $440, $450
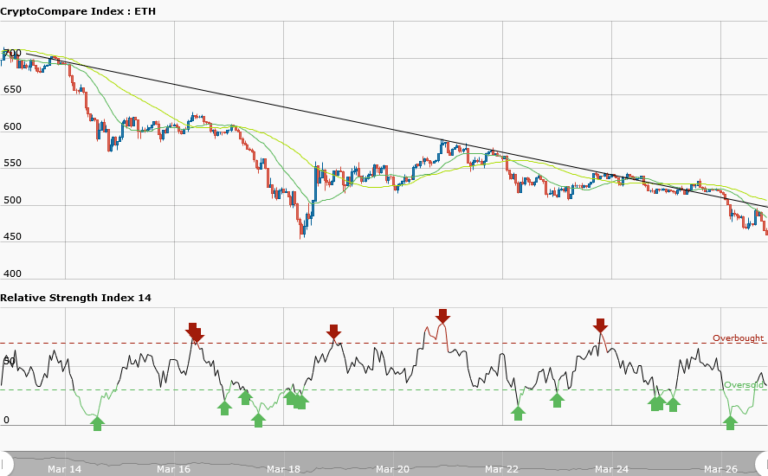
Price of Ethereum was fluctuating between the resistance at $600 and the support at $450 as at March 26, 2018. Today, Ethereum is in a smooth downtrend trading at $462.11. A bearish trend line has been drawn showing the resistance levels where a trader can take a short trade. The trend line is overlapping the price bars in the downtrend.
In a downtrend traders should look out for sell setups. In a bearish market, it is expected that if price retraces from the low, a resistance level would be created where traders can take short trades. However, as long as price does not break the trend line the downtrend will continue. If the downtrend continues the support levels would be breached. Meanwhile, the 50-day moving average and 20-day moving average are trending southward.
Also, the RSI period 14 is level 34 which indicates that the market is oversold suggesting bulls taking control of the market.
ETHUSD Short-term trend: Bearish

On March 26th, 2018, price of Ethereum was nearing the oversold market condition but today the market is oversold. According to RSI period 14 is level 35 which indicates that the market is oversold suggesting bulls taking control of the market.
The views and opinions expressed here do not reflect that of CryptoGlobe.com and do not constitute financial advice. Always do your own research.


