

ETHUSD Medium-term Trend: Ranging
Resistance: $570, $560, $550
Support: $510, $520, $530
Yesterday from the weekly chart, Ethereum was in a downtrend with a bearish trend line showing the resistance levels of price. The price broke the bearish trend line to end the current downtrend. Today, from the weekly chart, the new trend is in a range bound movement. The current price action is in a range bound movement. Presently, Ethereum is trading at $549.28.
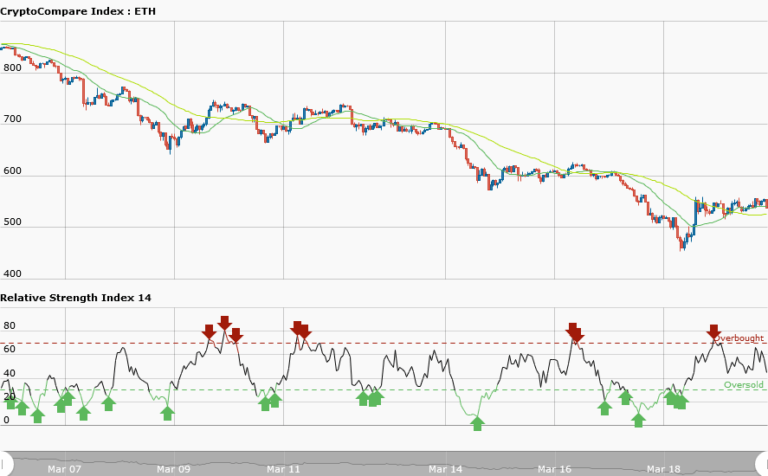
However, the 50-day moving average and 20-day moving average are following the ranging pattern. Meanwhile, the RSI period 14 is level 44 which indicates that price is in the range bound zone. Traders may wish to abstain from trading because of the ranging market.
ETHUSD Short-term trend: Ranging

From the daily chart, ETHUSD pair has a choppy price action. The price of Ethereum is in a ranging market because the price action is disorderly. Trading becomes impossible when the resistance and support levels are not evenly apart. However, the RSI period 14 is level 28 which indicates that the market is oversold suggesting bulls taking over the market.
Since the market is oversold traders should look for a buy setup in anticipation for a long order.


