

BTCUSD Medium-term Trend: Ranging
Resistance: $8,100, $8,000, $7,900
Support: $7,500, $7,600, $7,700
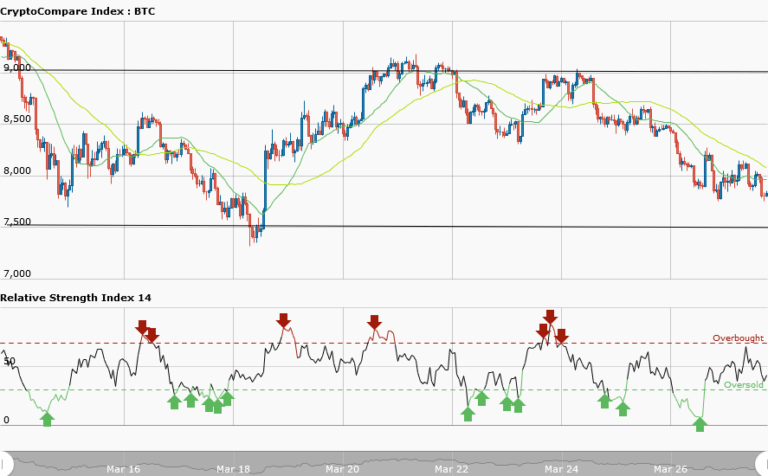
Price of Bitcoin had been in a range bound movement since March 16th, 2018. From the weekly chart, Bitcoin is trading above the lows of $7,500 since March 18. Also,the resistance level at $9,000 and the support level at $7,500 are yet to be broken since March 17th, 2018. Bitcoin is trading at $7,829.46 as at the time of writing. Meanwhile, the RSI period 14 is level 42 which indicates that price is in the range bound zone.
There are indications that the range bound movement will continue for now. The range bound movement is caused by indecision between the bulls and bears that have no control of the price.
BTCUSD Short-term Trend: Ranging

Yesterday, the bearish outlook of Bitcoin was short lived by the bulls. From the daily chart, price is fluctuating between the resistance at $8,100 and the support at $7,800. The support at $7,500 had been a difficult key level for the bears to break while the bulls have the $9,000 to contend with. Meanwhile, the RSI period 14 is level 52 which indicates that price is in the range bound zone.
The views and opinions expressed here do not reflect that of CryptoGlobe.com and do not constitute financial advice. Always do your own research.”


