

ZECUSD Medium-term Trend: Sideways
Supply levels: $460, $455, $450
Demand levels: $430, $435, $440
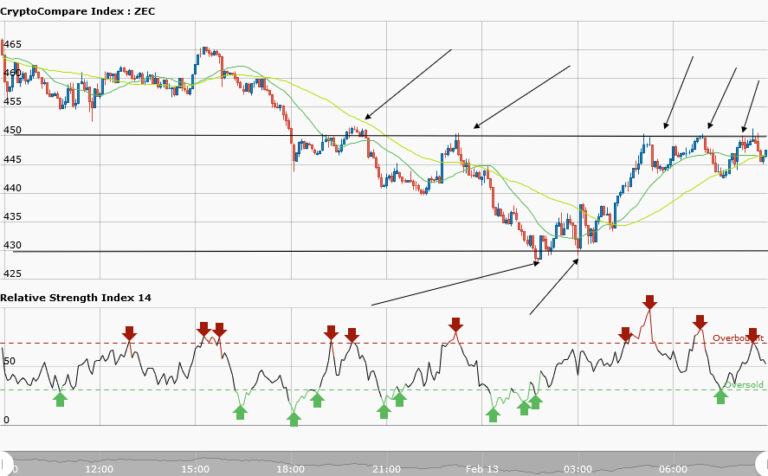
ZECUSD pair was trading at $463.94 in a sideways market yesterday. Today the market is still in a sideways movement but the price has fallen to $450.62 which is about 3.3% fall in price. There are three ways to identify the direction of the market namely an uptrend, a downtrend or ranging market (sideways). In the medium term trend we have a sideways market. The price at $450 is the resistance level while the price at $430 is the support level.
Price tested the resistance five times while two times it tested the support level. The market was not moving evenly therefore a single short trade on the first arrow in the middle of the chart will be okay. Your take profits at support zone.Similarly, you take a long order at the support level and you close the trade near the resistance level. However, the 50-day moving average and 20-day moving average are trending sideways whereas RSI period 14 is level 54 ‘
ZECUSD Short-term Trend: Sideways

In the short term trend, ZECUSD pair has been trading in a sideways market for the second day. The 50-day moving average and 20-day moving average are trending sideways. Traders should avoid sideways movement except the pattern is clear.


