

ETHUSD Medium-term Trend: Sideways
Resistance: $835, $830, $825
Support: $805, $810, $815
Last week, ETHUSD pair has been bullish on many days .With respect to last Monday’s price of $937.72 and current price of $821.64, there is a decline in price. The price fall was as a result of the assumptions that if the bulls break through the resistance levels the price may continue to rise but if the bears breach the demand levels then price will fall below the demand level.Today the weekly chart is on a sideways movement.
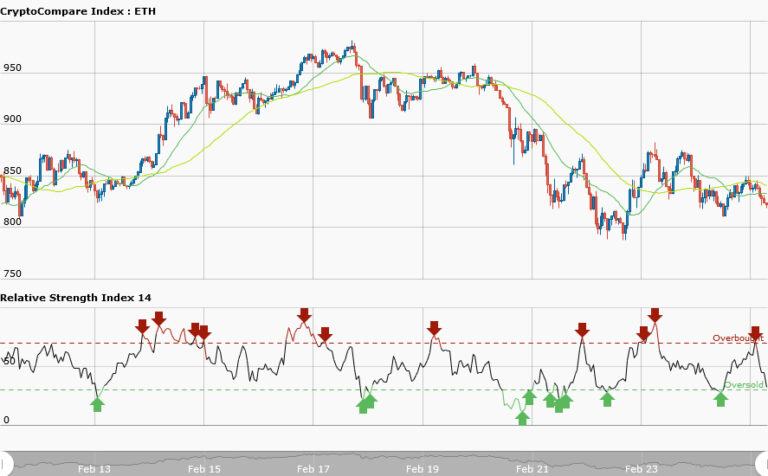
The 50-day moving average and 20-day moving average are moving sideways whereas the RSI period 14 is level 32 indicating that the market is oversold. This week the price will hover at the borders of the demand levels for sometime because of the sideways movement.
ETHUSD Short-term trend: Bearish

In the short term trend, ETHUSD pair has a bearish outlook because moving averages are above the candlesticks. The 50-day moving average and 20-day moving average are moving southward whereas the RSI period 14 is level 36 indicating that the market is reaching the oversold condition. The price may breach the demand levels of the market. Then traders can then take a long position.


