
ETHUSD Medium-term Trend: Bullish
Resistance: $1300, $1200, $1100
Support: $600, $700, $800
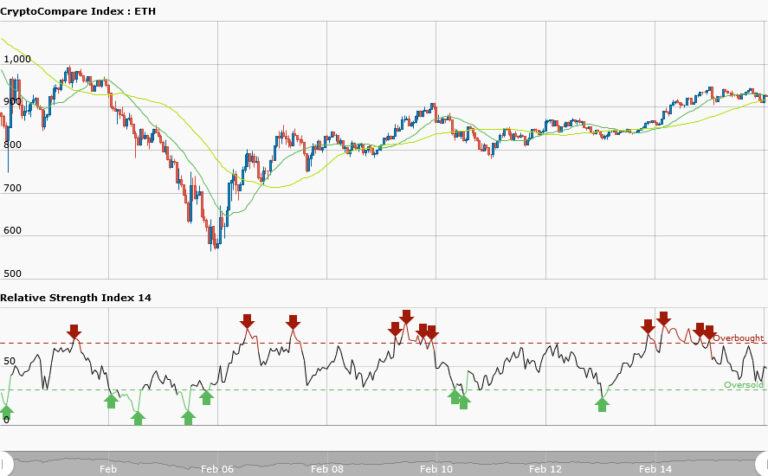
In the medium term trend the market has been sideways for the past previous days. However, the 20-day moving average is above 50-day moving average indicating that price is rising ; whereas RSI period 14 is level 49 indicating that the price has reached the bullish trend zone.
ETHUSD Short-term trend: Bullish

Yesterday, ETHUSD was trading in a bullish market. There were predictions that the price will rise as long as the market is bullish. Traders can profit in the uptrend movement.That they needed to look out for retracement or pull back in the uptrend. These are swing points to look out for to place your long trades.Yesterday, the RSI indicator was in divergence with price trend.
I said this was a strong signal and that a possible reversal in price is imminent.Today,ethereum has moved from the bullish market to a sideways market .It is currently trading at $939.60.However, the price at $940 is the resistance level while the price at $920 is the support level. These are the levels the price will be oscillating before a breakout.
Therefore if you have followed the sideways trend from its inception you will place a short trade at each of those arrows and exit your trade near the support zone. At the support, you place a long trade at each of those arrows and exit your trade near the resistance zone. However, the RSI period 14 is level 31 indicating that the market is oversold.