

ETHUSD Medium-term Trend: Bullish
Resistance: $900, $890, $880
Support: $840, $850, $860
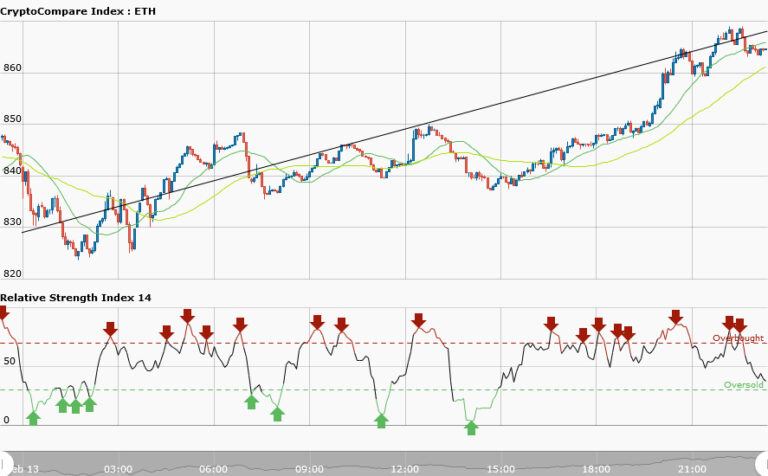
ETHUSD was trading at $854.79 in a sideways trend yesterday. Traders were told that they would have gotten eight trading opportunities if they commenced trading at the beginning of the trend. Price also appreciated by 3% yesterday.Today, ETHUSD is trading at $866.58 in an uptrend which is about 1.4% price increase. To determine the market direction a trend line is drawn across the price bars.
In an uptrend when a trend line is drawn across the price bars from the lower left corner of the chart to the upper right corner as shown in the chart; the line will overlap the price bars several times indicating a real trend. In an uptrend you can follow the familiar logic of buying low and selling high. While in an uptrend, if a currency pair retraces from its recent high, it will create a support level where traders can go long.
In other words, traders who wish to go long can enter a position when price pulls back.
ETHUSD Short-term trend: Sideways

The short term trend is sideways. The 50-day moving average and 20-day moving average are trending without a discernible pattern; that is trending neither northward nor southward. In shorter term frame trading should be suspended.


