

BTCUSD Medium-term Trend: Bullish
Resistance: $10,800, $10,600, $10,400
Support: $9,600, $9,800, $10,000
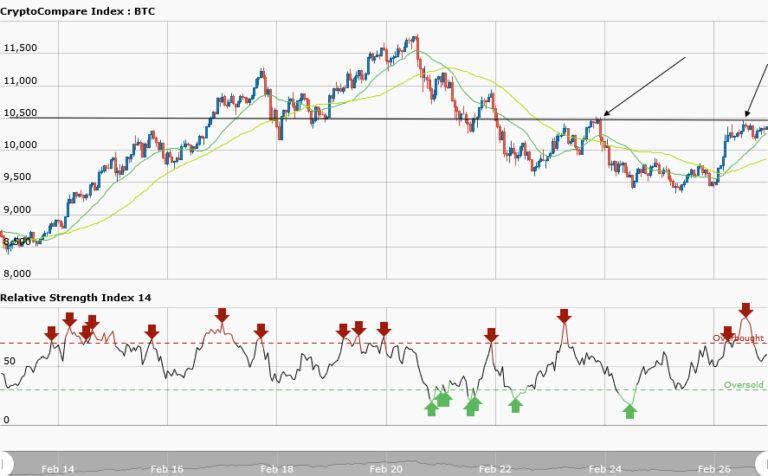
In the early hours of Monday 26, bitcoin was trading at $9,586.14 in a sideways movement. It was assumed that since it has fallen to his lows, the price will only fluctuates for some time in a sideways market. But that wasn’t the case as the price broke through the support level of $9400 to its recent high of $11,500. Presently, BTCUSD pair is trading at $10,344.44.
However, from the weekly chart, $10,500 was earlier a support level that was broken and now a resistance level. The price has tested the resistance level twice and has difficulty breaking that level.The price will be hovering around this region until further notice.However, the RSI period 14 is level 60 indicates that price is in the bullish trend zone.
If the bulls push further the price and break the resistance level then the price may go beyond $11,500.Traders should buy if the price breaks the resistance level.
BTCUSD Short-term Trend: Bullish

The short term trend is a bullish market because the moving averages are below the candlesticks. Secondly, 50-day moving average and the 20-day moving average are moving northwards whereas RSI period 14 is level 63 indicates that the price is in the bullish trend zone


