

BTCUSD Medium-term Trend: Bullish
Resistance: $12,000, $11,800, $10,600
Support: $10,800, $11,000, $11,200
Yesterday, the weekly chart showed that the trend is bullish. Bitcoin will rise as long as the market remains bullish. Monday 19, price of $10,843.73 has risen to $11,430.90 today. The weekly chart shows that BTCUSD is in a smooth uptrend movement. An uptrend is present when prices make series of higher highs (HH) and higher lows (HL).
Traders can follow the familiar logic of buying low and selling high. Secondly, in an uptrend if a currency retraces from the recent high it will create support level. Traders who wish to go long can take a position when the price pulls back to its support level.
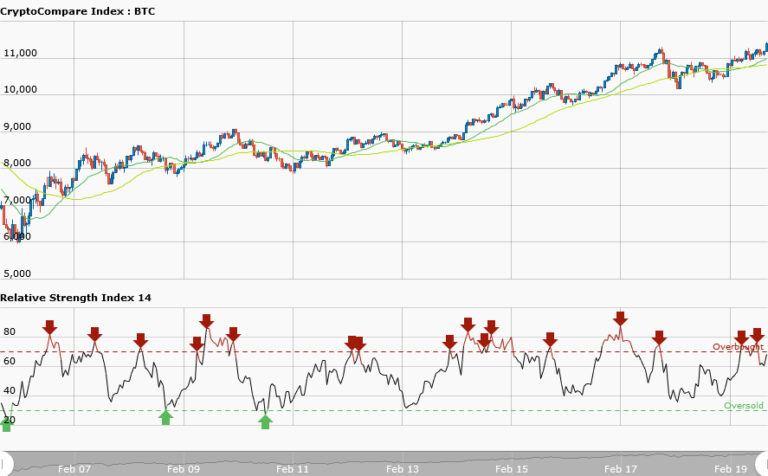
Meanwhile, the 50-day moving average and the 20-day moving average are trending northward whereas RSI period 14 is level 60 indicating that price has entered the bullish trend zone.
BTCUSD Short-term Trend: Bullish

Yesterday the daily chart was in a bearish outlook.The price in the bearish trend has a retracement from the low at $10,200 which was one of the demand levels of the market.
This retracement led to the current uptrend.Today, BTCUSD is an uptrend on the daily chart. However, the 50-day moving average and the 20-day moving average are trending northward whereas RSI period 14 is level 90 indicating that the market is overbought suggesting that bears would soon take control.


