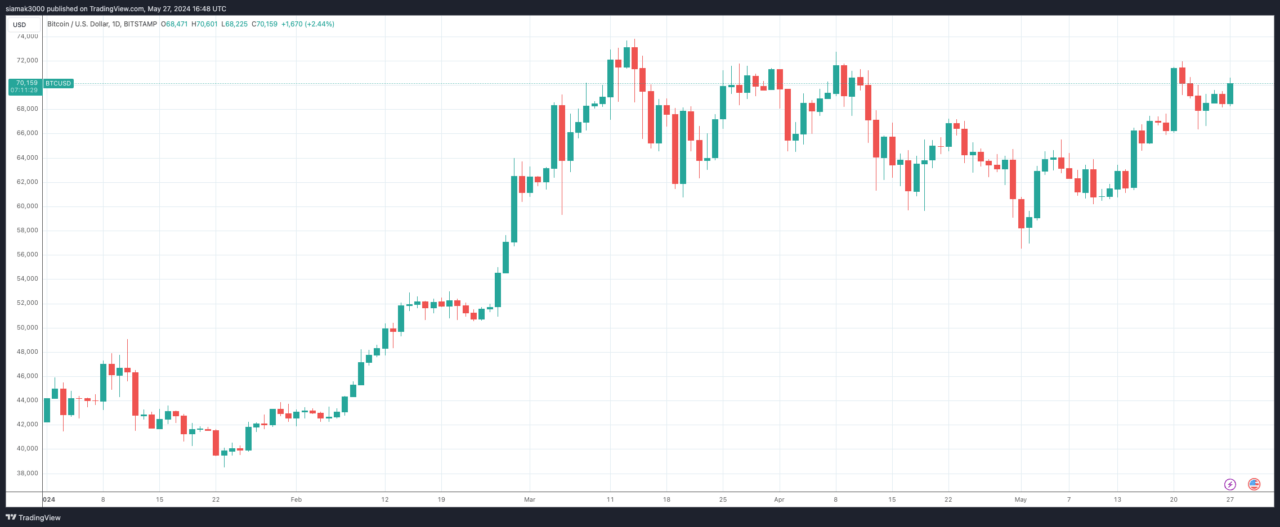
As of 27 May 2024, Bitcoin (BTC) is trading against the US Dollar (USD) on Bitstamp at approximately $70,159, marking a daily increase of $1,670 (+2.44%). This comprehensive technical analysis explores Bitcoin’s price movement, identifies key support and resistance levels, and examines potential future scenarios.
Overview of Current Market Conditions
The TradingView chart below offers a daily (1D) timeframe analysis, revealing Bitcoin’s price journey from early 2024 to the present date. The chart illustrates a robust uptrend with occasional corrections, suggesting strong bullish momentum in the market.

Key Observations
Trend Analysis:
- Uptrend: Since the start of 2024, Bitcoin has shown a significant uptrend. The price surged from around $40,000 to over $70,000, highlighting persistent buying interest and strong bullish momentum.
- Corrections: Several corrections are visible on the chart, characterized by sharp declines. However, these corrections were followed by swift recoveries, indicating the resilience of the uptrend.
Support and Resistance Levels:
- Support Levels: The chart identifies key support levels around $60,000 and $52,000. These levels have acted as strong buy zones, where the price rebounded after facing corrections.
- Resistance Levels: The primary resistance level is currently at $70,000. Bitcoin’s ability to break and sustain above this level will be crucial for continued bullish momentum.
Candlestick Patterns:
- Bullish Candles: The chart displays several large bullish candles, signifying strong buying interest, especially during phases of the uptrend.
- Bearish Candles: Bearish candles appear during corrections but are relatively smaller compared to bullish ones, suggesting that sell-offs were not as intense.
Moving Averages:
- Short-Term Moving Averages: While not explicitly shown on the chart, it is likely that short-term moving averages are below the current price, indicating a strong uptrend.
- Long-Term Moving Averages: Similarly, long-term moving averages are expected to be below the current price, reinforcing the bullish trend.
Volume Analysis:
- Volume Spikes: Although volume data is not visible on the chart, significant price movements usually align with volume spikes, confirming the strength of those moves.
Potential Scenarios
Bullish Scenario:
- Breakout Above $70,000: If Bitcoin breaks and sustains above the $70,000 resistance level, it could signal further upward movement. The next target might be around $75,000 or higher, based on previous patterns of price behavior after breaking significant resistance levels. This scenario would indicate strong continued interest from buyers and could set the stage for new all-time highs.
Bearish Scenario:
- Failure to Break $70,000: If Bitcoin fails to break above $70,000, it could result in a pullback to the nearest support levels around $68,000 or $60,000.
- Extended Correction: A more significant correction could drive the price back to around $52,000, the next major support level.
Conclusion
The overall sentiment derived from the chart is bullish, with Bitcoin currently testing the $70,000 resistance level. The observed trend demonstrates strong bullish momentum, reinforced by multiple support levels that provide a cushion against potential downward movements. Traders and investors should closely monitor Bitcoin’s behavior around the $70,000 mark to anticipate future price action.
If Bitcoin manages to break and sustain above this key resistance level, it could pave the way for further upward movement, potentially targeting $75,000 or higher. Conversely, a failure to break $70,000 might lead to a pullback, with $68,000 and $60,000 serving as crucial support levels to watch.
Featured Image via Pixabay


