
Introduction
This report provides a comprehensive analysis of XRP (XRP) for 22 June 2023. The data includes real-time price, volume, bid/ask, day’s range, technical indicators, and moving averages.
Price and Volume Overview
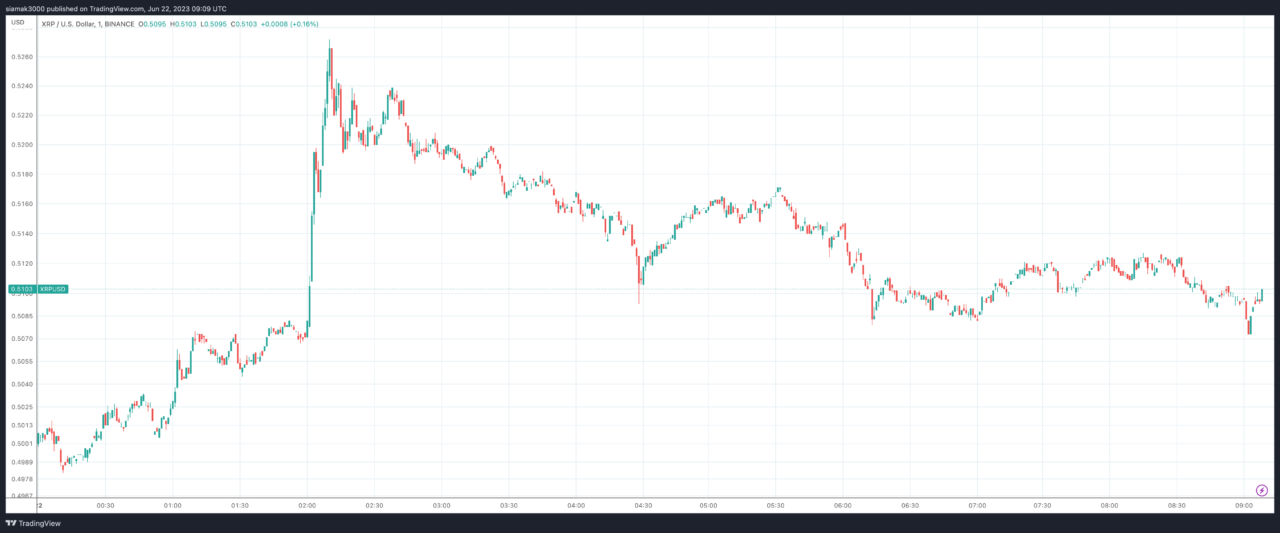
As of 9:00 a.m. UTC on 22 June 2023, on Binance, XRP is trading at $0.50910, up by $0.01230 (+2.48%) from its previous close. The trading volume over the last 24 hours was 446,951,330 XRP. The bid price is $0.50910, and the ask price is $0.50920. The day’s range is between $0.49050 and $0.52720.
Technical Indicators
Technical indicators are used to predict future price movements and market trends.
Here’s a detailed breakdown of the technical indicators for Ripple (XRP):
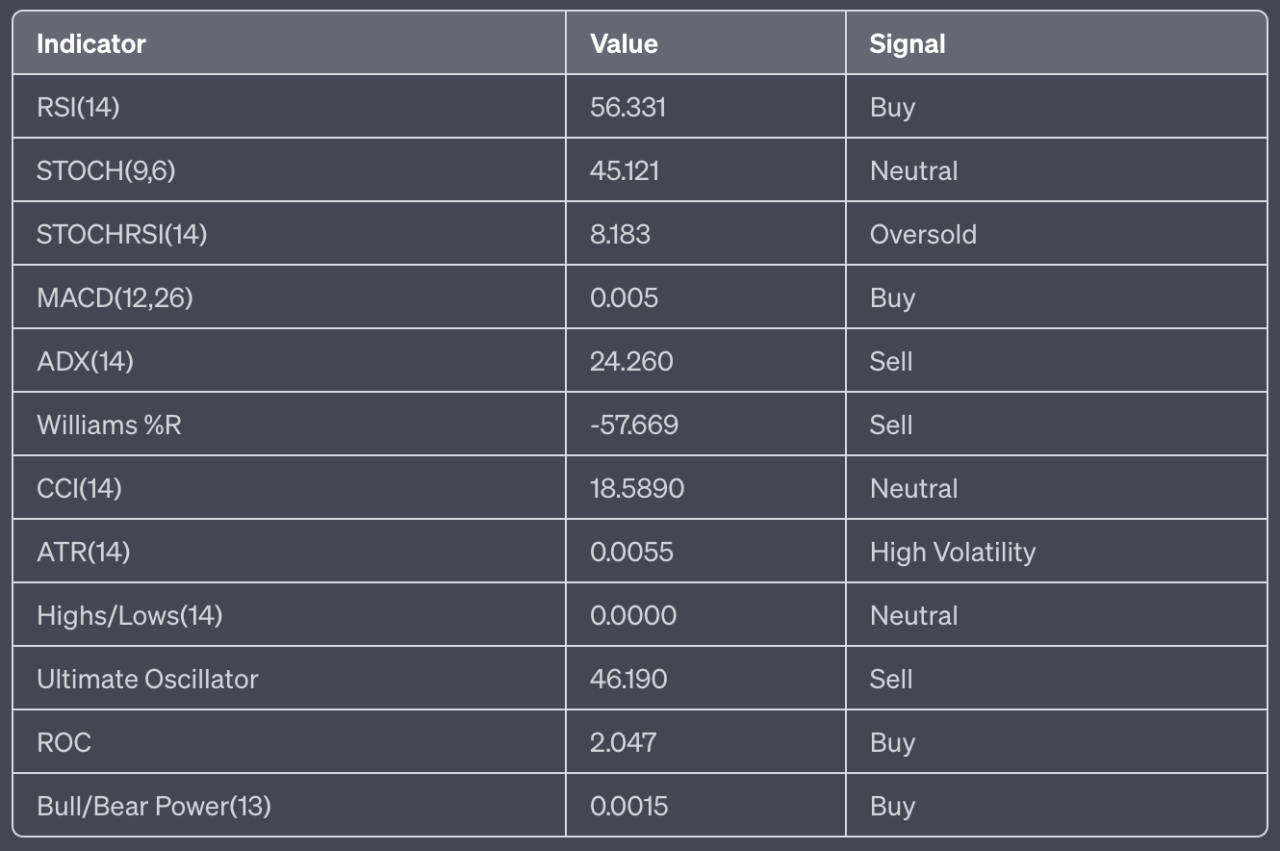
RSI(14): The 14-day Relative Strength Index is 56.331, indicating a buy position. The RSI measures the speed and change of price movements on a scale of 0 to 100. Traditionally, the asset is considered overbought when the RSI is above 70 and oversold when it’s below 30. In this case, XRP is neither overbought nor oversold, suggesting a balance between buying and selling pressures.
STOCH(9,6): The Stochastic Oscillator is 45.121, indicating a neutral condition. This momentum indicator compares a particular closing price of the asset to a range of its prices over a certain period of time. The current value suggests that XRP is neither closer to its highs nor its lows, which is typically viewed as a neutral signal.
STOCHRSI(14): The Stochastic RSI is 8.183, indicating an oversold condition. This is a technical momentum indicator that compares the level of the RSI to its high-low range over a set time period. An oversold condition could indicate a buying opportunity as the price might rebound soon.
MACD(12,26): The Moving Average Convergence Divergence is 0.005, indicating a buy position. The MACD is a trend-following momentum indicator that shows the relationship between two moving averages of a security’s price. The MACD line crossing above the signal line can be a bullish signal, and when it crosses below, it can be a bearish signal. In this case, the MACD line is above the signal line, indicating a bullish signal.
ADX(14): The Average Directional Index is 24.260, indicating a sell position. The ADX is used to measure the strength or weakness of a trend, not the actual direction. Values below 20 are often associated with non-trending markets, and values above 25 may indicate a trend. In this case, the ADX value is below 25, indicating a weaker trend.
Williams %R: The Williams %R is -57.669, indicating a sell condition. This momentum indicator measures overbought and oversold levels. Readings range from 0 to -100, with -50 as the middle line. Readings above -20 are considered overbought, and readings below -80 are considered oversold. The current reading suggests that XRP is in a sell condition.
CCI(14): The Commodity Channel Index is 18.5890, indicating a neutral position. The CCI is a momentum-based oscillator used to help determine when an investment vehicle is reaching a condition of being overbought or oversold. A CCI above 100 may indicate an overbought condition, while a CCI below -100 may indicate an oversold condition.
ATR(14): TheAverage True Range is 0.0055, indicating high volatility. The ATR is a technical analysis indicator that measures market volatility by decomposing the entire range of an asset price for that period.
Highs/Lows(14): The value is 0.0000, indicating a neutral position. This indicator is used to identify the highest and lowest prices for the asset over a particular period.
Ultimate Oscillator: The value is 46.190, indicating a sell condition. This is a technical indicator that is used to measure momentum across multiple timeframes. A value above 70 often indicates an overbought condition, while a value below 30 indicates an oversold condition.
ROC: The Rate of Change is 2.047, indicating a buy position. The ROC is a momentum oscillator, which measures the percentage change between the current price and the n-period past price.
Bull/Bear Power(13): The value is 0.0015, indicating a buy position. These indicators measure the balance of power between bulls (buyers) and bears (sellers).
In summary, the technical indicators present a mixed outlook for XRP. Four indicators (RSI, MACD, ROC, and Bull/Bear Power) are suggesting a buy signal, indicating bullish momentum and a potential upward price movement. However, three indicators (ADX, Ultimate Oscillator, and Williams %R) are suggesting a sell signal, indicating a potential weakening of the current trend and a bearish momentum.
The Stochastic Oscillator is neutral, and the Stochastic RSI indicates an oversold condition, which could suggest a potential price rebound in the near future. The CCI is also neutral, and the ATR indicates high volatility, suggesting larger price swings.
Moving Averages
Moving averages are a type of data smoothing technique that analysts use in technical analysis to identify trends in a set of data, such as stock prices. They help to reduce the noise and fluctuation in price data to present a smoother line, making it easier to see the overall direction or trend.
There are several types of moving averages, but two of the most common ones are the Simple Moving Average (SMA) and the Exponential Moving Average (EMA).
Simple Moving Average (SMA): The SMA is calculated by adding the prices for a certain number of periods and then dividing by that number of periods. For example, a 5-day SMA would add the closing prices for the last five days and then divide by five. The SMA gives equal weight to all the data points in its calculation.
Exponential Moving Average (EMA): The EMA is similar to the SMA but gives more weight to recent data. This means it responds more quickly to recent price changes than the SMA. The calculation of the EMA is a bit more complex than the SMA, involving an exponential smoothing factor to givemore weight to recent prices.
The significance of different period moving averages (like 5-day, 10-day, 20-day, 50-day, 100-day, and 200-day) lies in the timeframe that traders are interested in:
5-day, 10-day, and 20-day moving averages are often used for short-term trends. They respond quickly to price changes and are useful for traders looking to take advantage of short-term price movements. 50-day and 100-day moving averages are more medium-term. They are less sensitive to daily price fluctuations and provide a clearer picture of the medium-term trend. 200-day moving average is a long-term trend indicator. It’s less sensitive to daily price fluctuations and provides a clearer picture of the long-term trend. Many traders consider a market to be in a long-term uptrend when the price is above the 200-day moving average and in a long-term downtrend when it’s below.
It’s important to note that moving averages are lagging indicators, meaning they are based on past prices. They can help identify a trend but won’t predict future price movements.
Here’s a detailed breakdown of the moving averages for XRP:
Simple Moving Averages (SMA):
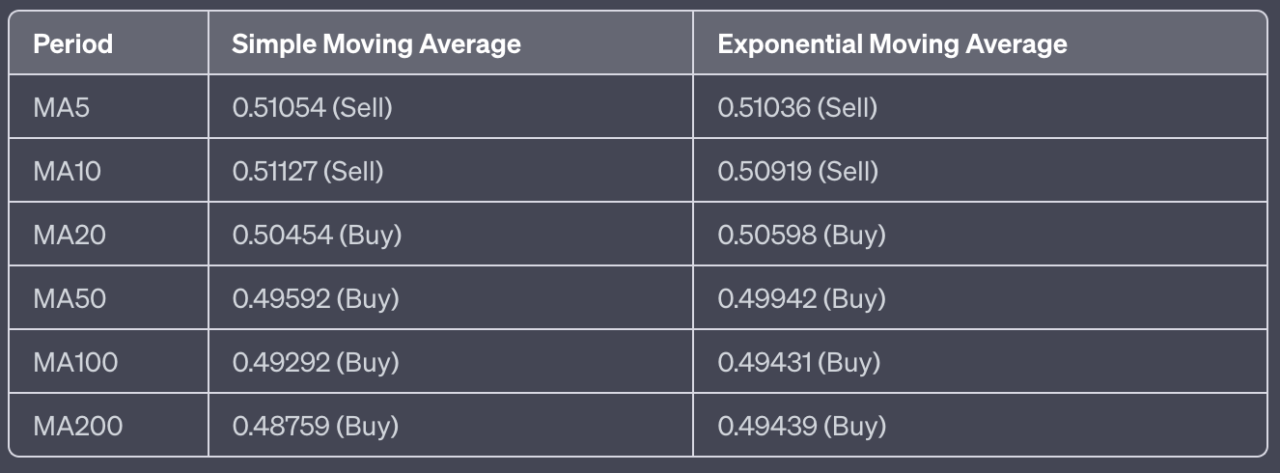
- MA5: The 5-day SMA is at 0.51054, which is above the current price. This is typically considered a sell signal as it suggests that the price is trending downward in the short term.
- MA10: The 10-day SMA is at 0.51127, also above the current price, which reinforces the sell signal in the short term.
- MA20: The 20-day SMA is at 0.50454, which is below the current price. This is a buy signal, suggesting that the price is trending upward in the medium term.
- MA50: The 50-day SMA is at 0.49592, which is below the current price, reinforcing the buy signal in the medium term.
- MA100: The 100-day SMA is at 0.49292, which is below the current price. This is a buy signal, suggesting that the price is trending upward in the long term.
- MA200: The 200-day SMA is at 0.48759, which is below the current price. This reinforces the buy signal in the long term.
Exponential Moving Averages (EMA):
- MA5: The 5-day EMA is at 0.51036, which is above the current price. This is typically considered a sell signal as it suggests that the price is trending downward in the short term.
- MA10: The 10-day EMA is at 0.50919, also above the current price, which reinforces the sell signal in the short term.
- MA20: The 20-day EMA is at 0.50598, which is below the current price. This is a buy signal, suggesting that the price is trending upward in the medium term.
- MA50: The 50-day EMA is at 0.49942, which is below the current price, reinforcing the buy signal in the medium term.
- MA100: The 100-day EMA is at 0.49431, which is below the current price. This is a buy signal, suggesting that the price is trending upward in the long term.
- MA200: The 200-day EMA is at 0.49439, which is below the current price. This reinforces the buy signal in the long term.
In summary, the moving averages suggest a buy signal for XRP with eight buy signals and four sell signals. The short-term trend, represented by the 5-day and 10-day moving averages, is bearish as they are suggesting a sell. However, the medium and long-term trends, represented by the 20-day, 50-day, 100-day, and 200-day moving averages, are bullish as they are all suggesting a buy. This mixed signal can be interpreted as a period of uncertainty or consolidation for XRP, where the price is likely to fluctuate within a certain range before a clear trend emerges.
Conclusion
In conclusion, the market sentiment for XRP as of June 22, 2023, leans towards a bullish outlook, but with some caution. The technical indicators present a mixed picture, with four indicators suggesting a “Buy” action, three indicators suggesting a “Sell” action, and three indicators remaining neutral. The Stochastic RSI indicates an oversold condition, which could potentially lead to a price increase if a reversal occurs. However, the ADX, Ultimate Oscillator, and the Williams %R are indicating a sell signal, suggesting a potential weakening of the current trend, a bearish momentum, and an overbought condition, respectively.
The moving averages, particularly the long-term ones, reinforce this bullish sentiment, with the 20-day, 50-day, 100-day, and 200-day moving averages all indicating a buy signal. This suggests that the overall trend for XRP is upward, and the price is expected to increase in the long term. However, the 5-day and 10-day moving averages are indicating a sell signal, suggesting a potential short-term downward price movement.
As always, it’s important to note that while technical analysis tools can provide useful insights, they are not a guarantee of future performance, and all trading strategies should be used in conjunction with other market information and individual research.
Featured Image Credit: Photo / illustration by “Dylan Calluy” via Unsplash