

Introduction
Welcome to our comprehensive price analysis report for XRP as of June 10, 2023. This report is based on price data, technical indicators, and moving average data sourced from Binance at 06:59 AM UTC. We delve into the intricate dynamics of XRP’s price, volume, and key technical indicators. Whether you’re a seasoned trader or a curious observer, this report offers valuable insights into XRP’s performance on this day. So, let’s dive in and explore the market sentiment for XRP.
Price and Volume
The current price of XRP is $0.48830, with a decrease of -$0.03390 (-6.49%) from the previous price. The volume of XRP traded is 602,961,812, indicating a high level of activity and interest in this cryptocurrency. Volume refers to the number of shares or contracts traded in a security or market during a given period. The day’s range is between $0.47200 and $0.54180, showing a relatively large fluctuation in price. The day’s range refers to the difference between the highest and lowest prices of a security during a trading day.
Technical Analysis
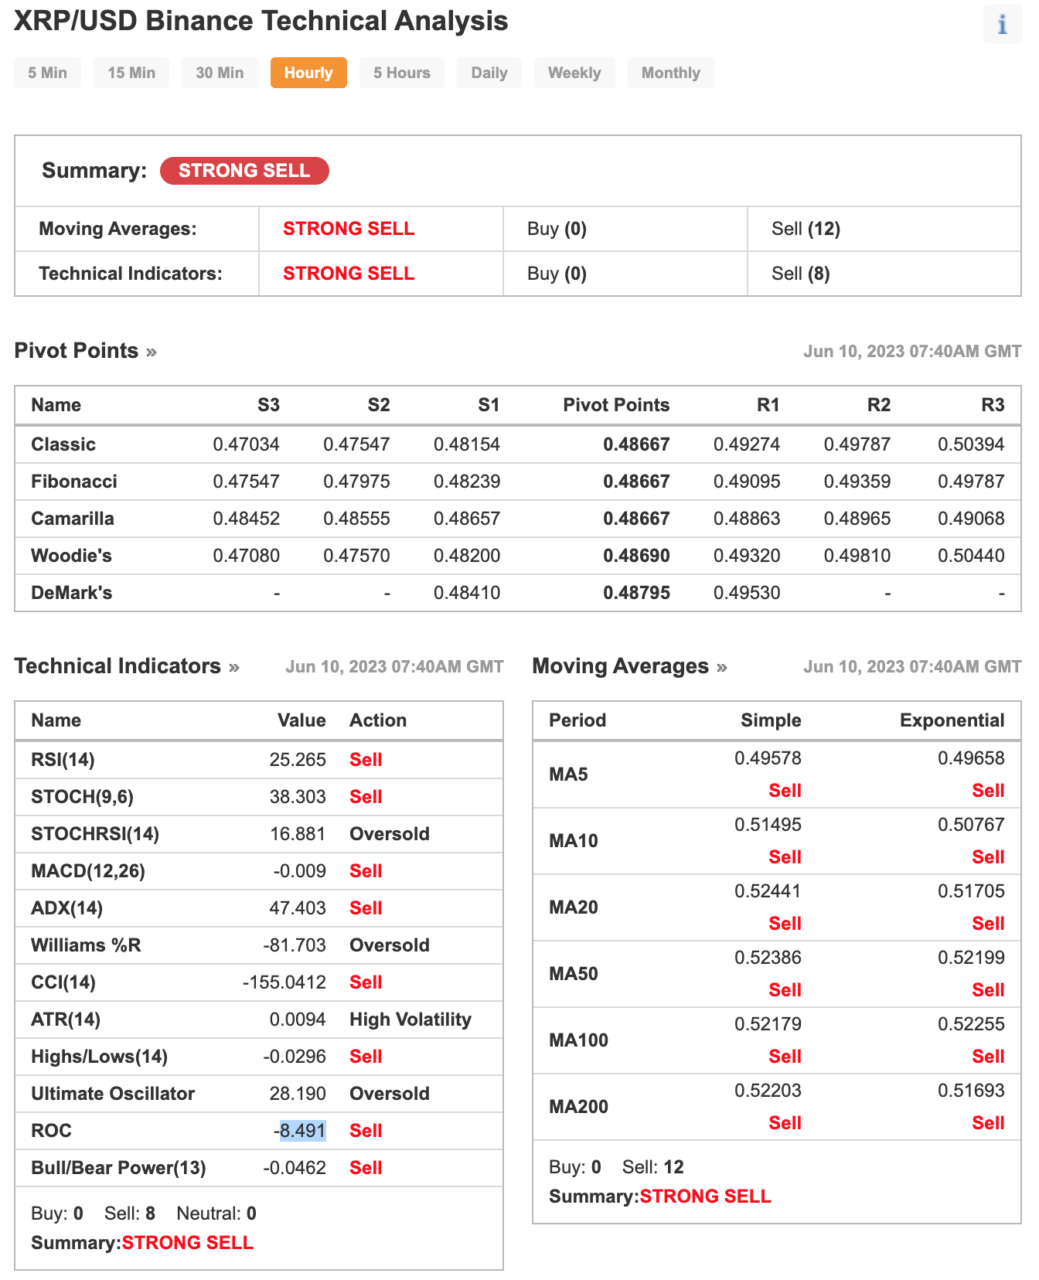
Technical analysis is a trading discipline employed to evaluate investments and identify trading opportunities by analyzing statistical trends gathered from trading activity, such as price movement and volume. The overall technical analysis for XRP is showing a strong sell signal. This is based on the 0 buy signals and 8 sell signals from the technical indicators, and 0 buy signals and 12 sell signals from the Moving Averages.
Technical Indicators Used and What They Mean
RSI(14): The Relative Strength Index (RSI) is a momentum oscillator that measures the speed and change of price movements. It moves between 0 and 100, with readings below 30 generally considered oversold and readings above 70 considered overbought. The ’14’ in ‘RSI(14)’ refers to the period over which the RSI is calculated, in this case, 14 periods. An RSI of 24.604 indicates an oversold condition, suggesting a potential price correction in the near future.
STOCH(9,6): The Stochastic Oscillator is a momentum indicator that compares a particular closing price of a security to a range of its prices over a certain period of time. The two numbers in ‘STOCH(9,6)’ refer to the periods used to calculate the stochastic oscillator, in this case, 9 periods for the %K line and 6 periods for the %D line. A STOCH of 50.422 indicates a neutral signal, suggesting the price could move in either direction.
STOCHRSI(14): The Stochastic RSI applies the Stochastic Oscillator formula to a set of RSI values rather than standard price data. Like the RSI, it ranges between 0 and 1, with readings below 0.2 considered oversold and readings above 0.8 considered overbought. A STOCHRSI of 15.553 indicates an oversold condition, suggesting a potential price correction in the near future.
MACD(12,26): The Moving Average Convergence Divergence (MACD) is a trend-following momentum indicator that shows the relationship between two moving averages of a security’s price. The ’12’ and ’26’ in ‘MACD(12,26)’ refer to the periods used to calculate the two moving averages, in this case, 12 periods for the short-term average and 26 periods for the long-term average. A MACD of -0.007 indicates a sell signal, suggesting a potential price decline.
ADX(14): The Average Directional Index (ADX) is a technical analysis indicator used by market strategists to determine the strength of a trend. The ’14’ in ‘ADX(14)’ refers to the period over which the ADX is calculated, in this case, 14 periods. A high ADX value (typically above 25) indicates a strong trend, while a low value suggests a weak or non-existent trend. It’s important to note that the ADX doesn’t tell you the direction of the trend, just its strength. The ADX(14) is at 41.332, suggesting a sell signal.
Williams %R: This is a momentum indicator that measures overbought and oversold levels. It moves between 0 and -100 and is typically used to identify potential reversals in the market. A reading above -20 is generally considered overbought, while a reading below -80 is considered oversold. In this case, the Williams %R is at -82.650, indicating an oversold condition, which could suggest a potential price correction in the near future.
CCI(14): The Commodity Channel Index (CCI) is a versatile indicator that measures the difference between a security’s price change and its average price change. High positive readings indicate that prices are well above their average, which is a show of strength. On the other hand, low negative readings signal that prices are significantly below their average, indicating weakness. The CCI is often used to identify cyclical turns in commodities, but it can be applied to any market. In this case, the CCI(14) is at -227.9492, indicating an oversold condition.
ATR(14): The Average True Range (ATR) is a technical analysis indicator that measures market volatility. It is typically used to calculate stop loss levels. A higher ATR indicates higher volatility, and therefore larger price swings are expected. Conversely, a lower ATR suggests lower volatility. In this case, ATR(14) is 0.0094, suggesting high volatility, which could mean larger price swings.
The Highs/Lows is a simple indicator that calculates the highest and lowest prices over a specified period. The Ultimate Oscillator is a technical indicator that uses weighted sums of three oscillators (usually 7, 14, and 28 period time frames) to reduce volatility and false trading signals. ROC (Rate of Change) is a momentum oscillator, which measures the percentage change between the current price and the n-period past price. Here, Highs/Lows(14) is -0.0296, indicating a sell signal, Ultimate Oscillator is 28.190, indicating an oversold signal, and ROC is 8.491, indicating a sell signal.
Moving Averages
Moving Averages smooth out price data to form a trend following indicator. They do not predict price direction, but rather define the current direction with a lag. The numbers (5, 10, 20, 50, 100, 200) refer to the period used to calculate the moving average.
The Moving Averages indicate a strong sell signal with 0 buy signals and 12 sell signals. This could suggest a potential bearish trend in the longer term. The MA5, MA10, MA20, MA50, MA100, and MA200 are all above the current price, indicating a bearish short-term and long-term trend.
Pivot Points
The pivot points are used to identify potential support and resistance levels. Support and resistance levels are key concepts in technical analysis that denote the price levels at which a financial instrument’s price tends to stop and reverse. The numbers (5, 10, 20, 50, 100, 200) refer to the period used to calculate the moving average. The pivot point itself is a form of technical analysis indicator, used to determine the overall trend of the market over different time frames. The pivot point is calculated as an average of significant prices (high, low, close) from the performance of a market in the prior trading period. If the market in the following period trades above the pivot point, it is usually evaluated as a bullish sentiment, whereas trading below the pivot point is seen as bearish.
The current price is hovering around the S1 and R1 levels in all the pivot point calculations, suggesting that these are key levels to watch for potential price movements.
Conclusion
In summary, the XRP price analysis for June 10, 2023, based on data from Binance at 06:59 AM UTC, presents a picture leaning strongly toward sell. While the majority of technical indicators and moving averages hint at a potential bearish trend. This divergence underscores the importance of a balanced and informed approach to trading and investing. As always, these signals should be considered in the context of your overall investment strategy and risk tolerance. Remember, the world of cryptocurrency is highly volatile, and while technical analysis can provide valuable insights, it’s only one piece of the puzzle.
Featured Image Credit: Photo / illustration by “Dylan Calluy” via Unsplash


