

Introduction
This report provides an analysis of the cryptocurrency XRP (XRP) based on the latest data as of 20 June 2023. The analysis includes a review of the current price, volume, bid/ask prices, day’s range, technical indicators, and moving averages.
Price and Volume Overview
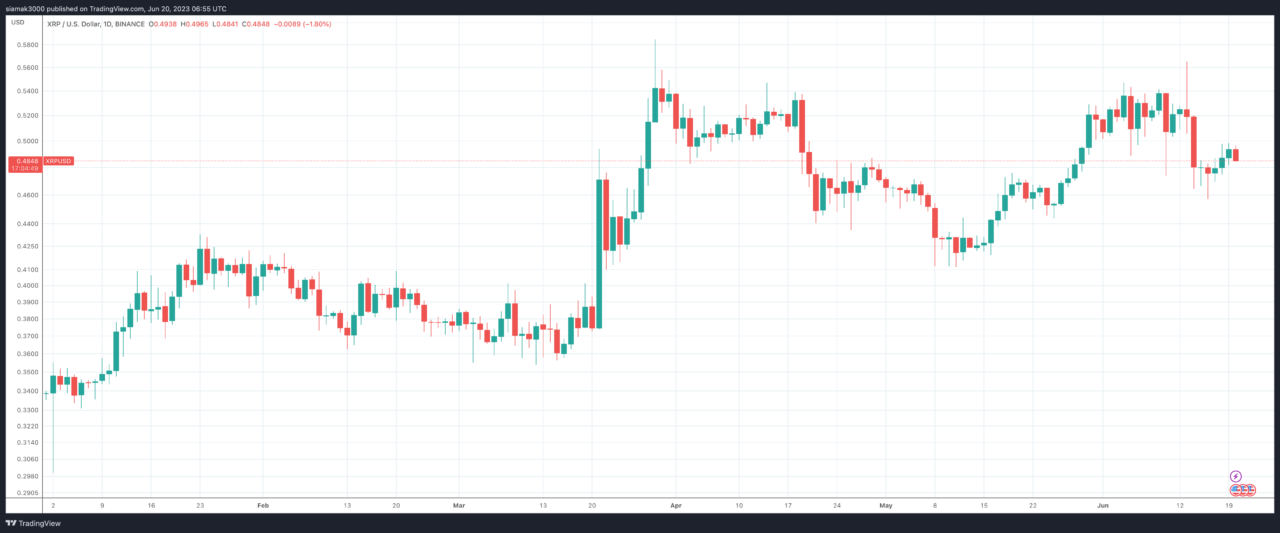
As of 6:11 a.m. UTC on 20 June 2023, XRP is trading at $0.48690, down by $0.00540 (-1.10%) from the previous close. The volume stands at 320,875,892 XRP. The bid and ask prices are $0.48680 and $0.48690, respectively. The day’s range has been between $0.48550 and $0.49910.
Technical Indicators
Technical indicators are statistical tools traders and investors use to predict future price movements and market trends.
Here’s a detailed breakdown of the technical indicators for XRP (XRP):
- RSI(14): The 14-day Relative Strength Index is 42.519, indicating a sell position. This suggests that the price momentum is leaning towards the sellers. The RSI is a momentum oscillator that measures the speed and change of price movements on a scale of 0 to 100. Traditionally, the asset is considered overbought when the RSI is above 70 and oversold when it’s below 30.
- STOCH(9,6): The Stochastic Oscillator is 34.092, indicating a sell position. This suggests that the price momentum is leaning toward the sellers. The Stochastic Oscillator is a momentum indicator that uses support and resistance levels. The term “stochastic” refers to the point of a current price in relation to its price range over a period of time.
- STOCHRSI(14): The Stochastic RSI is 0.000, indicating an oversold condition. This suggests that the price might be in a downward momentum. The Stochastic RSI is an oscillator that measures the level of the RSI relative to its high-low range over a set time period.
- MACD(12,26): The Moving Average Convergence Divergence is 0.000, indicating a buy position. This suggests that the short-term momentum is leaning toward the buyers. The MACD is a trend-following momentum indicator that shows the relationship between two moving averages of a security’s price.
- ADX(14): The Average Directional Index is 18.307, indicating a neutral position. This suggests that the price might be in a sideways trend. The ADX is used to measure the strength or weakness of a trend, not the actual direction.
- Williams %R: The Williams %R is -97.321, indicating an oversold condition. This suggests that the market is in a bearish condition. The Williams %R is a momentum indicator that measures overbought and oversold levels.
- CCI(14): The Commodity Channel Index is -181.8323, indicating a sell position. This suggests that the price is currently below its average price and, thus, in a bearish condition. The CCI is a momentum-based oscillator used to help determine when an investment vehicle is reaching a condition of being overbought or oversold.
- ATR(14): The Average True Range is 0.0037, indicating high volatility. This suggests that the price is making large movements, which could mean the price changes might be sudden and significant. The ATR is a technical analysis indicator that measures market volatility by decomposing the entire range of an asset price for that period.
- Highs/Lows(14): The value is -0.0030, indicating a sell position. This suggests that the price might be in a downward momentum. This indicator is used to identify the highest and lowest prices for the asset over a particular period.
- Ultimate Oscillator: The value is 39.350, indicating a sell position. This suggests that the price momentum is leaning toward the sellers. The Ultimate Oscillator is a technical indicator used to measure momentum across multiple timeframes.
- ROC: The Rate of Change is -0.286, indicating a sell position. This suggests that the price might be in a downward momentum. The ROC is a momentum oscillator, which measures the percentage change between the current price and the n-period past price.
- Bull/Bear Power(13): The value is -0.0038, indicating a sell position. This suggests that the price momentum is leaning toward the sellers. The Bull Power measures the capacity of buyers to drive prices above the average consensus of value. The Bear Power, on the other hand, measures the capacity of sellers to drive prices below the average consensus of value.
Here is a summary of the technical indicators in table form:
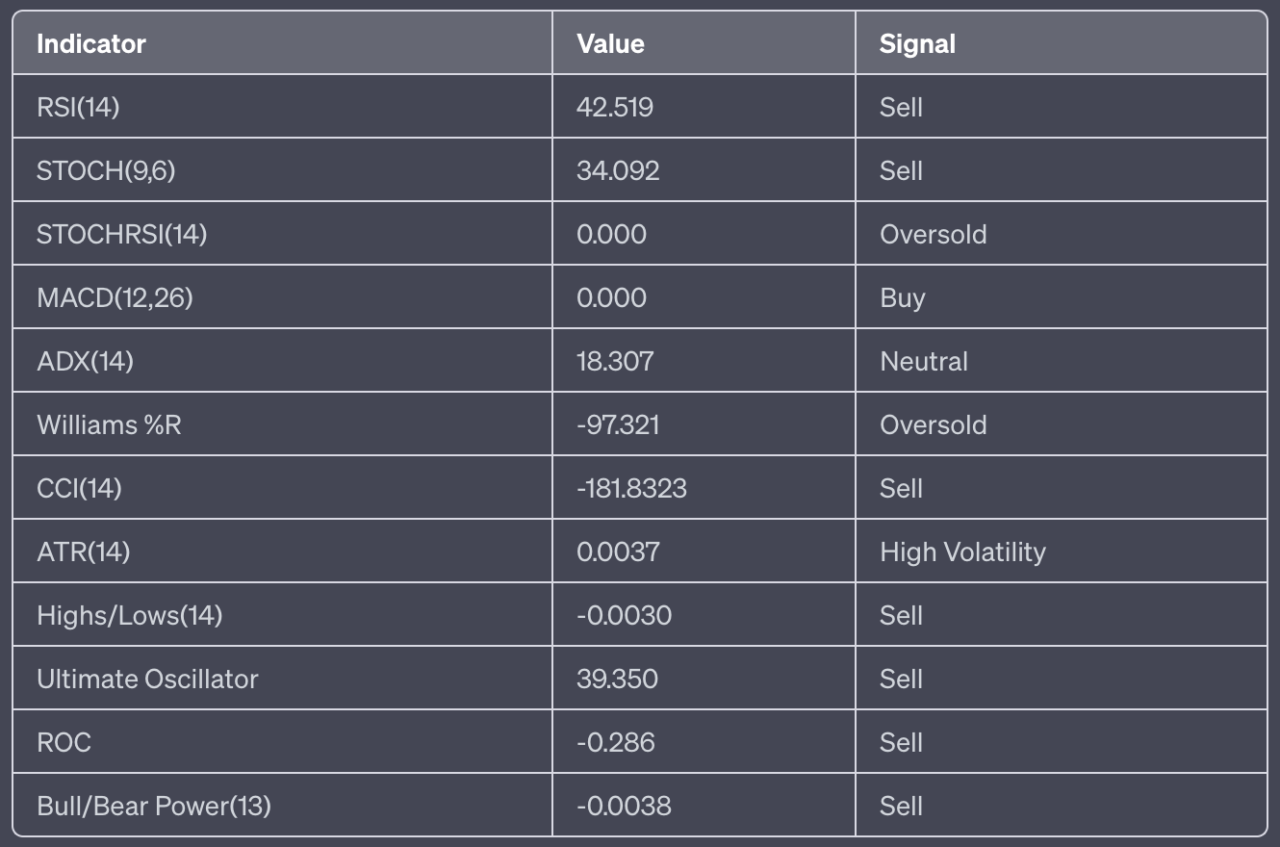
The technical indicators summary shows one buy signal, seven sell signals, and one neutral signal, leading to a summary action of “STRONG SELL”.
Moving Averages
Moving averages are a type of data smoothing technique that analysts use in technical analysis to identify trends in a set of data, such as stock prices. They help to reduce the noise and fluctuation in price data to present a smoother line, making it easier to see the overall direction or trend.
There are several types of moving averages, but two of the most common ones are the Simple Moving Average (SMA) and the Exponential Moving Average (EMA).
- Simple Moving Average (SMA): The SMA is calculated by adding the prices for a certain number of periods and then dividing by that number of periods. For example, a 5-day SMA would add the closing prices for the last five days and then divide by five. The SMA gives equal weight to all the data points in its calculation.
- Exponential Moving Average (EMA): The EMA is similar to the SMA but gives more weight to recent data. This means it responds more quickly to recent price changes than the SMA. The calculation of the EMA is a bit more complex than the SMA, involving an exponential smoothing factor to give more weight to recent prices.
The significance of different period moving averages (like 5-day, 10-day, 20-day, 50-day, 100-day, and 200-day) lies in the timeframe that traders are interested in:
- 5-day, 10-day, and 20-day moving averages are often used for short-term trends. They respond quickly to price changes and are useful for traders looking to take advantage of short-term price movements.
- 50-day and 100-day moving averages are more medium-term. They are less sensitive to daily price fluctuations and provide a clearer picture of the medium-term trend.
- 200-day moving average is a long-term trend indicator. It’s less sensitive to daily price fluctuations and provides a clearer picture of the long-term trend. Many traders consider a market to be in a long-term uptrend when the price is above the 200-day moving average and in a long-term downtrend when it’s below.
It’s important to note that moving averages are lagging indicators, meaning they are based on past prices. They can help identify a trend but won’t predict future price movements.
Here’s a detailed breakdown of the moving averages for XRP (XRP):
- MA5: The 5-day SMA is 0.49006, and the 5-day EMA is 0.49005, both indicating a sell position. This suggests that the price is currently below the average of the past five days.
- MA10: The 10-day SMA is 0.49185, and the 10-day EMA is 0.49076, indicating a sell and sell position, respectively. This suggests that the price is currently below the average of the past ten days.
- MA20: The 20-day SMA is 0.49119, and the 20-day EMA is 0.49117, both indicating a sell position. This suggests that the price is currently below the average of the past 20 days.
- MA50: The 50-day SMA is 0.48970, and the 50-day EMA is 0.48860, both indicating a sell position. This suggests that the price is currently below the average of the past 50 days.
- MA100: The 100-day SMA is 0.48295, indicating a buy position, and the 100-day EMA is 0.48925, indicating a sell position. This suggests that the price is currently around the average of the past 100 days.
- MA200: The 200-day SMA is 0.49435, and the 200-day EMA is 0.49326, both indicating a sell position. This suggests that the price is currently below the average of the past 200 days.
Here is a summary of the moving averages in table form:
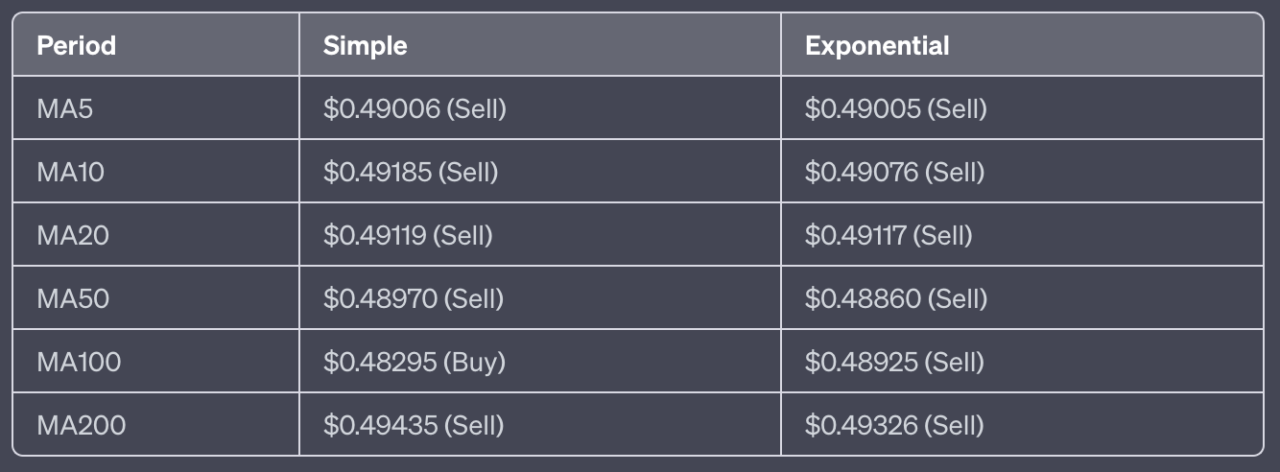
The moving averages summary shows one buy signal and eleven sell signals, leading to a summary action of “STRONG SELL”.
Conclusion
The market conditions for XRP as of 20 June 2023 are predominantly bearish. Both the technical indicators and the moving averages lean towards a “sell” action, indicating a potential downward movement in the price of XRP.
The high volatility indicated by the ATR(14) suggests that the price changes might be sudden and significant. The sell signals from the RSI(14), STOCH(9,6), MACD(12,26), Williams %R, ROC, and Bull/Bear Power(13) indicate that the price momentum is leaning towards the sellers. The oversold condition indicated by the STOCHRSI(14) and Williams %R suggests that the asset is currently being heavily sold, which could lead to a potential price correction in the future.
In conclusion, while the market conditions are currently bearish, traders and investors should still exercise caution. The sell signals from the technical indicators and moving averages suggest that there might be some price corrections in the short term. Furthermore, the high volatility indicated by the ATR(14) suggests that any price changes might be sudden and significant.
As always, while technical analysis tools can provide useful insights, they are not a guarantee of future performance, and all trading strategies should be used in conjunction with other market information and individual research.
Featured Image Credit: Photo / illustration by “Dylan Calluy” via Unsplash


