Introduction
Welcome to our comprehensive price analysis report for Solana (SOL) as of June 9, 2023. This report is based on price data, technical indicators, and moving average data sourced from Binance at 11:26:31 UTC. We delve into the intricate dynamics of SOL’s price, volume, and key technical indicators. Whether you’re a seasoned trader or a curious observer, this report offers valuable insights into SOL’s performance on this day. So, let’s dive in and explore the market sentiment for Solana.
Price and Volume
The current price of SOL is $18.860, with a slight decrease of -$0.080 (-0.42%) from the previous price. The volume of SOL traded is 2,485,819, indicating a high level of activity and interest in this cryptocurrency. The day’s range is between $18.470 and $19.370, showing a relatively small fluctuation in price.
Technical Analysis
The overall technical analysis for SOL shows a neutral signal. This is based on the three buy signals and three sell signals from the technical indicators, and three buy signals and nine sell signals from the Moving Averages.
Technical Indicators
The RSI(14) is at 50.262, indicating a neutral signal as it’s at the midpoint. The STOCH(9,6) is at 64.530, indicating a buy signal. The STOCHRSI(14) is at 43.290, indicating a sell condition. The MACD(12,26) is at 0.043, indicating a buy signal. The ADX(14) is at 24.472, suggesting a sell signal. The Williams %R, CCI(14), Highs/Lows(14), and Ultimate Oscillator are all neutral. The ATR(14) suggests high volatility, which could mean larger price swings. The ROC is at 0.212, indicating a buy signal. The Bull/Bear Power(13) is at -0.1000, indicating a sell signal.
Moving Averages
The Moving Averages are indicating a sell signal with 3 buy signals and 9 sell signals. This could suggest a potential bearish trend in the longer term. The MA20 and MA50 are below the current price, indicating a bullish short-term trend. However, the MA5, MA10, MA100, and MA200 are above the current price, indicating a bearish long-term trend.
Pivot Points
The pivot points are used to identify potential support and resistance levels. The current price is hovering around the S1 and R1 levels in all the pivot point calculations, suggesting that these are key levels to watch for potential price movements.
Conclusion
In summary, the Solana (SOL) price analysis for June 9, 2023, based on data from Binance at 11:26:31 UTC, presents a neutral picture. While some technical indicators suggest a buy, the moving averages hint at a potential bearish trend in the longer term. This divergence underscores the importance of a balanced and informed approach to trading and investing. As always, these signals should be considered in the context of your overall investment strategy and risk tolerance. Remember, the world of cryptocurrency is highly volatile, and while technical analysis can provide valuable insights, it’s only one piece of the puzzle.
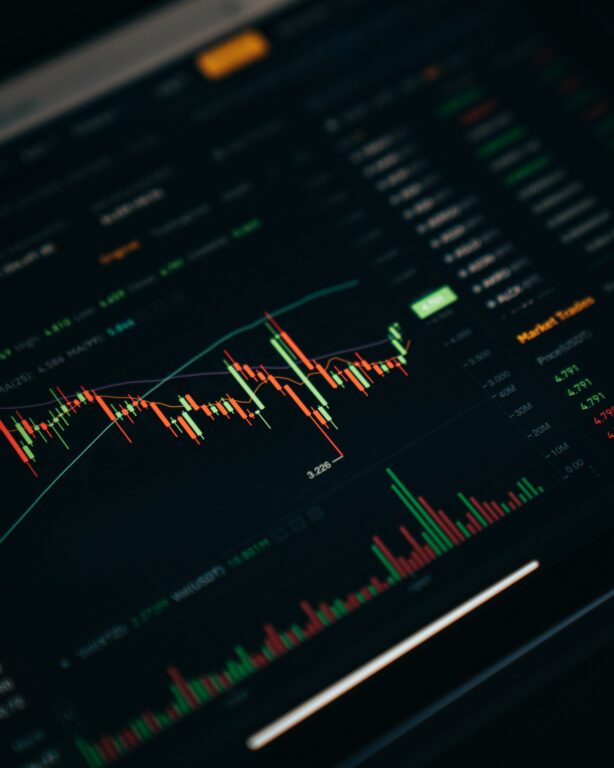
Featured Image Credit: Photo / illustration by “Dylan Calluy” via Unsplash


