

Introduction
This report provides a comprehensive analysis of Shiba Inu’s (SHIB) price dynamics on Binance, covering technical indicators, moving averages, and pivot points.
Price and Volume Overview
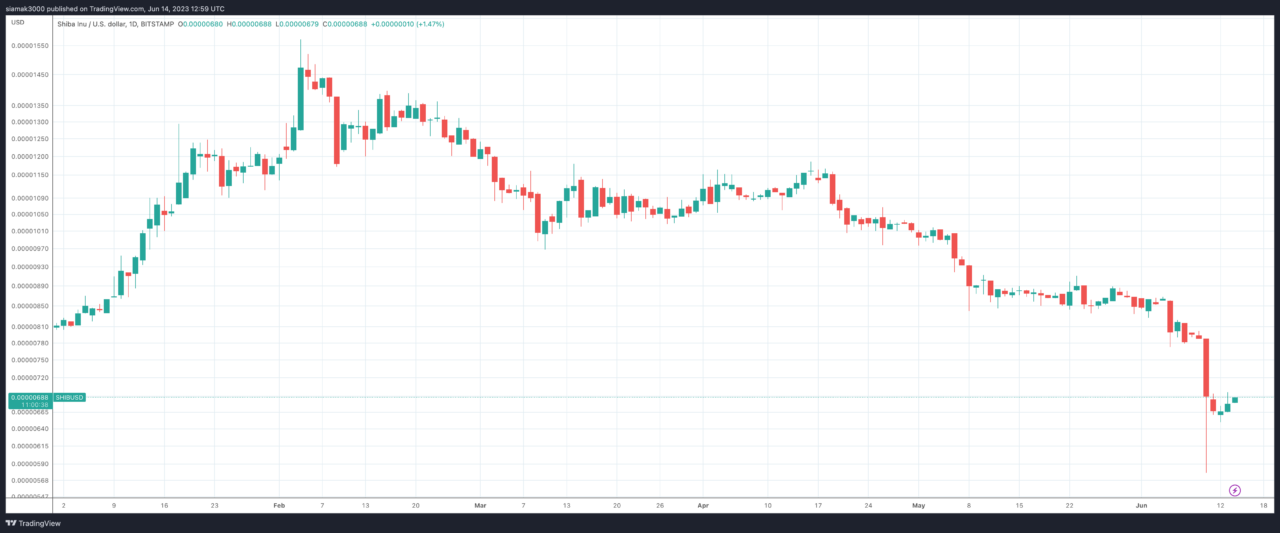
As of 12:47 p.m. UTC on 14 June 2023, on Binance, the price of SHIB is $0.00000691, which is an increase of $0.00000013 (+1.92%) from the previous close. The volume of SHIB traded in the last 24 hours is 1,406,374,710,293. The highest price of SHIB in the last 24 hours was $0.00000691, and the lowest price was $0.00000663. The bid price is $0.00000690, and the ask price is $0.00000691.
Technical Indicators
Technical indicators are mathematical calculations that use historical price, volume, and (in the case of futures contracts) open interest information to predict future price movements.
Here’s a detailed breakdown of the technical indicators for SHIB:
- RSI(14): The Relative Strength Index (RSI) compares the magnitude of recent gains to recent losses in an attempt to determine overbought and oversold conditions of an asset. An RSI of 66.091 indicates a buy position.
- STOCH(9,6): The Stochastic Oscillator compares a security’s closing price to its price range over a specific period of time. A value of 61.417 indicates a buy position.
- STOCHRSI(14): The Stochastic RSI combines two popular indicators, the Stochastic Oscillator and the Relative Strength Index. A value of 100.000 suggests that the asset is in an overbought condition, which typically results in a sell signal. However, it’s important to note that assets can remain in overbought or oversold conditions for an extended period of time.
- MACD(12,26): The Moving Average Convergence Divergence (MACD) is a trend-following momentum indicator that shows the relationship between two moving averages of a security’s price. A value of 0.000 indicates a neutral position.
- ADX(14): The Average Directional Index (ADX) is used to measure the strength or weakness of a trend, not the actual direction. A value of 33.322 indicates a buy position.
- Williams %R: The Williams %R is a momentum indicator that measures overbought and oversold levels. A value of 0.000 suggests that the asset is in an overbought condition, which typically results in a sell signal. However, it’s important to note that assets can remain in overbought or oversold conditions for an extended period of time.
- CCI(14): The Commodity Channel Index (CCI) is a momentum-based oscillator used to help determine when an investment vehicle is reaching a condition of being overbought or oversold. A value of 238.4210 indicates an overbought condition, which typically results in a sell signal.
- ATR(14): The Average True Range (ATR) is a market volatility indicator. A value of 0.0000 suggests high volatility. Highs/Lows(14): This value represents the highest and lowest prices over thelast 14 days. A value of 0.0000 indicates a buy position.
- Ultimate Oscillator: The Ultimate Oscillator is a technical indicator that is used to identify potential price reversals. A value of 71.924 indicates an overbought condition, which typically results in a sell signal.
- ROC: The Rate of Change (ROC) is a momentum oscillator, which measures the percentage change between the current price and the n period past price. A value of 2.222 indicates a buy position.
- Bull/Bear Power(13): The Elder-Ray Index, developed by Dr. Alexander Elder, is an oscillator that measures the power of bulls and bears in the market. A value of 0.0000 indicates a neutral position.
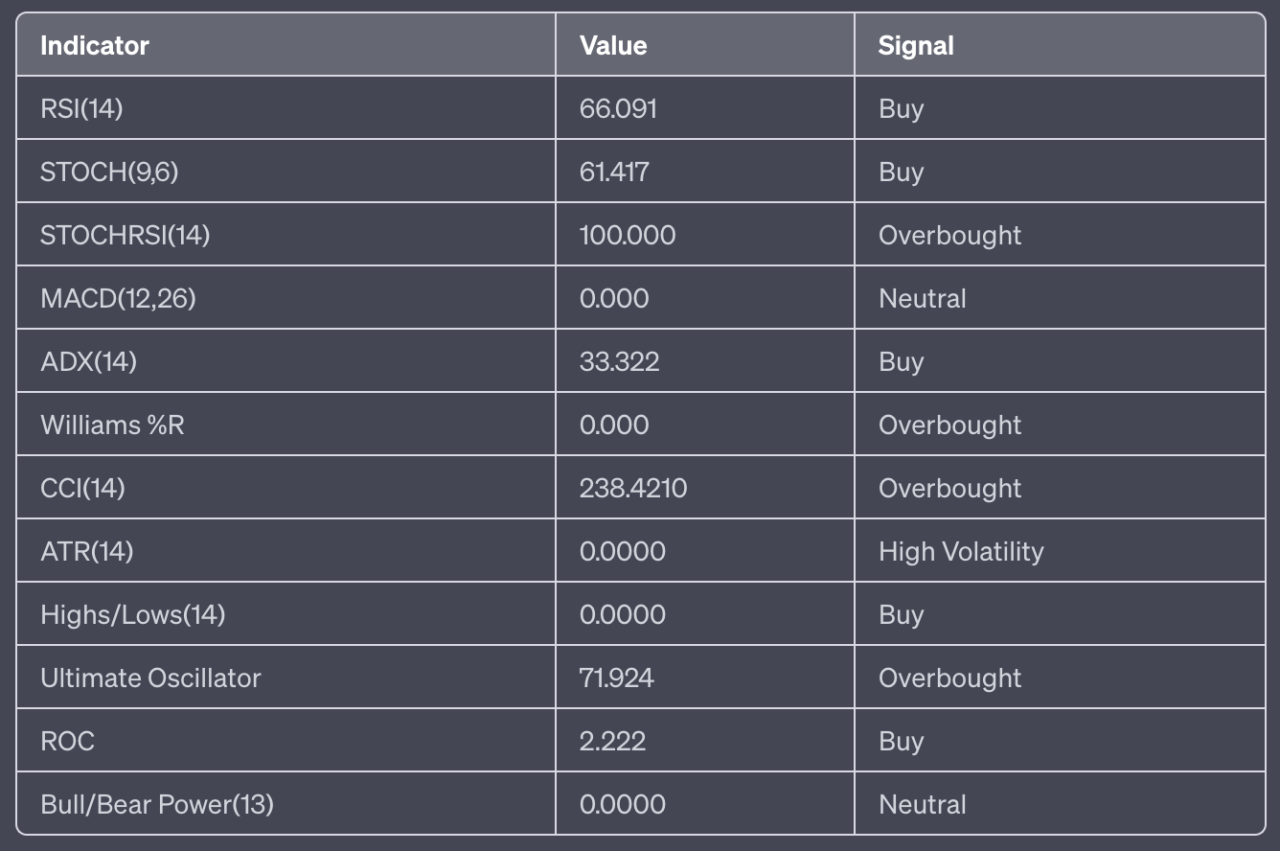
In summary, the technical indicators suggest a mixed sentiment for SHIB since there are five buy signals, zero sell signals, and two neutral signals. The overall summary is a BUY.
Moving Averages
Moving averages are a type of data smoothing technique that analysts use in technical analysis to identify trends in a set of data, such as stock prices. They help to reduce the noise and fluctuation in price data to present a smoother line, making it easier to see the overall direction or trend.
There are several types of moving averages, but two of the most common ones are the Simple Moving Average (SMA) and the Exponential Moving Average (EMA).
- Simple Moving Average (SMA): The SMA is calculated by adding together the prices for a certain number of periods and then dividing by that number of periods. For example, a 5-day SMA would add together the closing prices for the last 5 days and then divide by 5. The SMA gives equal weight to all the data points in its calculation.
- Exponential Moving Average (EMA): The EMA is similar to the SMA, but it gives more weight to recent data. This means it responds more quickly to recent price changes than the SMA. The calculation of the EMA is a bit more complex than the SMA, involving an exponential smoothing factor to give more weight to recent prices.
The significance of different period moving averages (like 5-day, 10-day, 20-day, 50-day, 100-day, and 200-day) lies in the timeframe that traders are interested in:
- 5-day, 10-day, and 20-day moving averages are often used for short-term trends. They respond quickly to price changes and are useful for traders looking to take advantage of short-term price movements.
- 50-day and 100-day moving averages are more medium-term. They are less sensitive to daily price fluctuations and provide a clearer picture of the medium-term trend.
- 200-day moving average is a long-term trend indicator. It’s less sensitive to daily price fluctuations and provides a clearer picture of the long-term trend. Many traders consider a market to be in a long-term uptrend when the price is above the 200-day moving average and in a long-term downtrend when it’s below.
It’s important to note that moving averages are lagging indicators, meaning they are based on past prices. They can help identify a trend but won’t predict future price movements.
Here’s a detailed breakdown of the moving averages for SHIB:
- MA5: The 5-day moving average is $0.00000686, indicating a buy position. The 5-day exponential moving average is $0.00000700, indicating a sell position.
- MA10: The 10-day moving average is $0.00000683, indicating a buy position. The 10-day exponential moving average is $0.00000700, indicating a sell position.
- MA20: The 20-day moving average is $0.00000681, indicating a buy position. The 20-day exponential moving average is $0.00000700, indicating a sell position.
- MA50: The 50-day moving average is $0.00000673, indicating a buy position. The 50-day exponential moving average is $0.00000700, indicating a sell position.
- MA100: The 100-day moving average is $0.00000670, indicating a buy position. The 100-day exponential moving average is $0.00000800, indicating a sell position.
- MA200: The 200-day moving average is $0.00000728, indicating a sell position. The 200-day exponential moving average is $0.00000900, indicating a sell position.
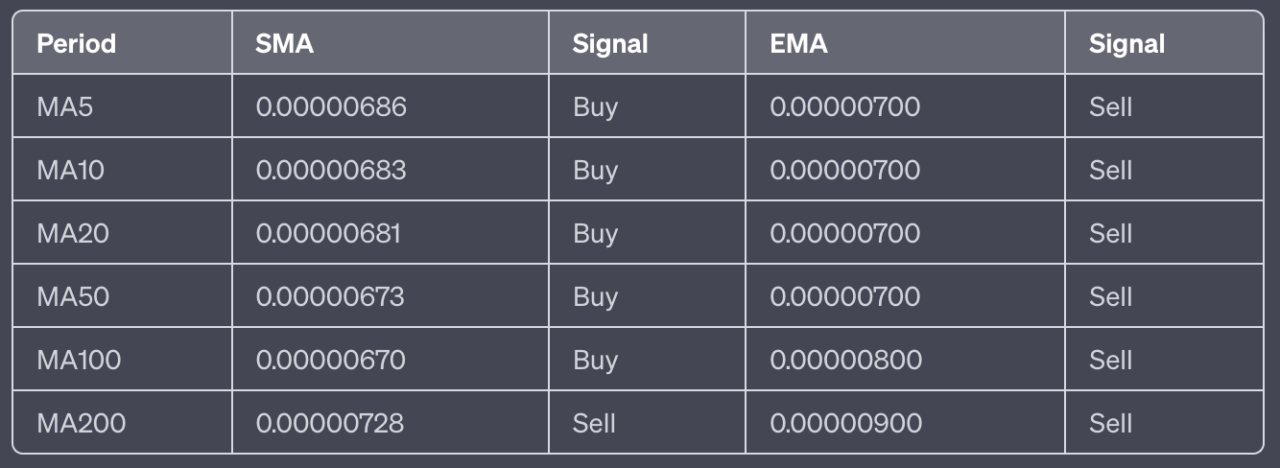
In summary, the moving averages suggest a bearish sentiment for SHIB since there are five buy signals and seven sell signals. The overall summary is a SELL.
Pivot Points
Pivot points are technical analysis indicators used to determine the overall trend of the market over different time frames. They are calculated using the high, low, and closing prices of a previous trading period. If the trading price for the next period is above the pivot point, it is considered a bullish sentiment, and if it is below the pivot point, it is considered bearish.
There are several methods to calculate pivot points, each with its own way of calculating support and resistance levels. Here are the methods used in this report:
- Classic: This is the most common method of calculating pivot points. The pivot point is calculated as the average of the high, low, and closing prices from the previous trading period. Support and resistance levels are then calculated off of this pivot point.
- Fibonacci: This method applies the mathematical concept of Fibonacci sequences to the price data to calculate the pivot point and associated support and resistance levels.
- Camarilla: This method uses a unique equation to calculate the pivot point and support and resistance levels, which often results in much closer levels than other methods.
- Woodie’s: This method gives more weight to the closing and opening prices when calculating the pivot point.
- DeMark’s: This method was developed by Tom DeMark and uses the relationship between the opening, closing, and high and low prices of the previous trading period to calculate the pivot point.
Here’s a detailed breakdown of the pivot points for SHIB:
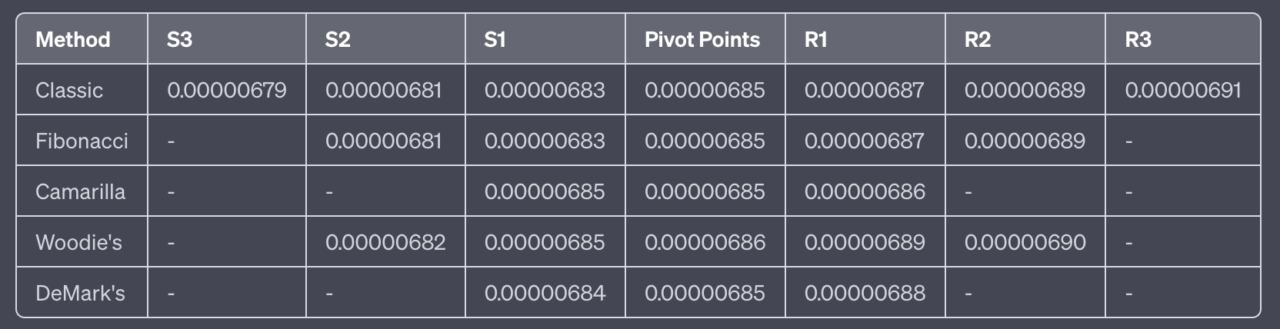
- Classic: The S3, S2, S1, Pivot Point, R1, R2, and R3 values are 0.00000679, 0.00000681, 0.00000683, 0.00000685, 0.00000687, 0.00000689, and 0.00000691 respectively.
- Fibonacci: The S2, S1, Pivot Point, R1, R2 values are 0.00000681, 0.00000683, 0.00000685, 0.00000687, and 0.00000689 respectively. The S3 and R3 values are not available for this method.
- Camarilla: The S1, Pivot Point, and R1 values are 0.00000685, 0.00000685, and 0.00000686 respectively. The S2, S3, R2, and R3 values are not available for this method.
- Woodie’s: The S2, S1, Pivot Point, R1, and R2 values are 0.00000681, 0.00000685, 0.00000686, 0.00000690, and 0.00000693 respectively. The S3 and R3 values are not available for this method.
- DeMark’s: The S1, Pivot Point, and R1 values are 0.00000684, 0.00000685, and 0.00000688 respectively. The S2, S3, R2, and R3 values are not available for this method.
Conclusion
Based on the technical indicators and the moving averages, Shiba Inu (SHIB) is currently showing mixed signals. The technical indicators suggest a buy, with five buy signals and no sell signals. The moving averages indicate a bearish trend, with five buy signals and seven sell signals.
As always, it’s important to note that while technical analysis tools can provide useful insights, they are not a guarantee of future performance, and all trading strategies should be used in conjunction with other market information and individual research.
Featured Image Credit: Photo / illustration by “Dylan Calluy” via Unsplash


